Supported by Dr. Osamu Ogasawara and  . . |
|
Last data update: 2014.03.03 |
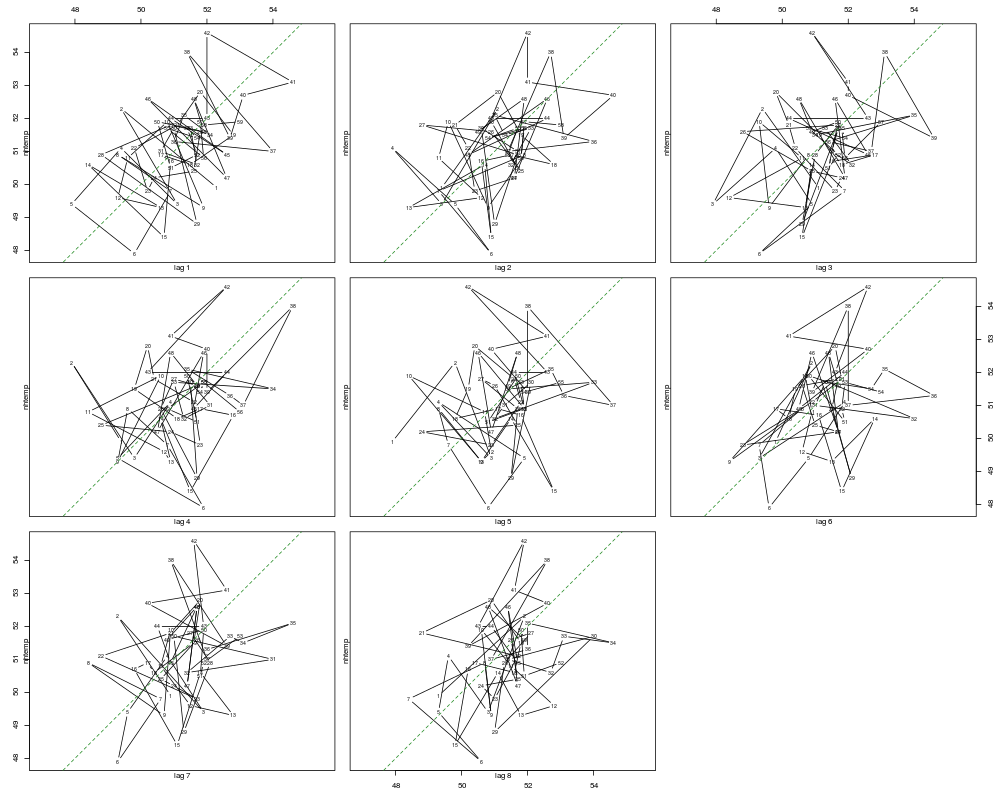
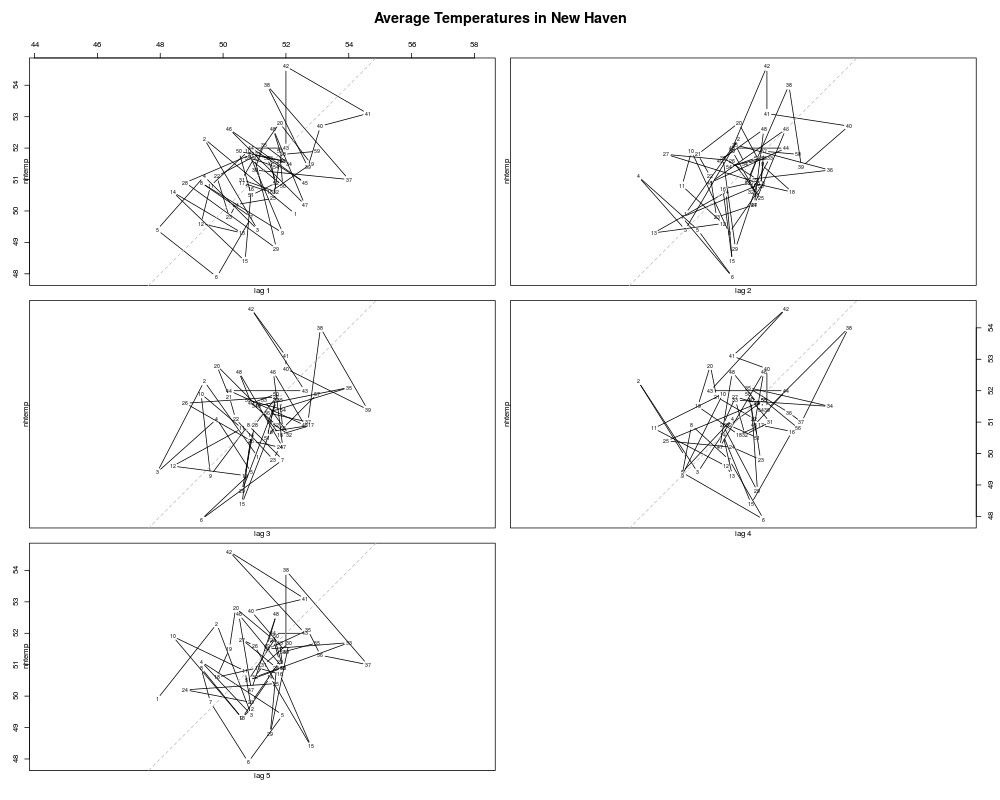
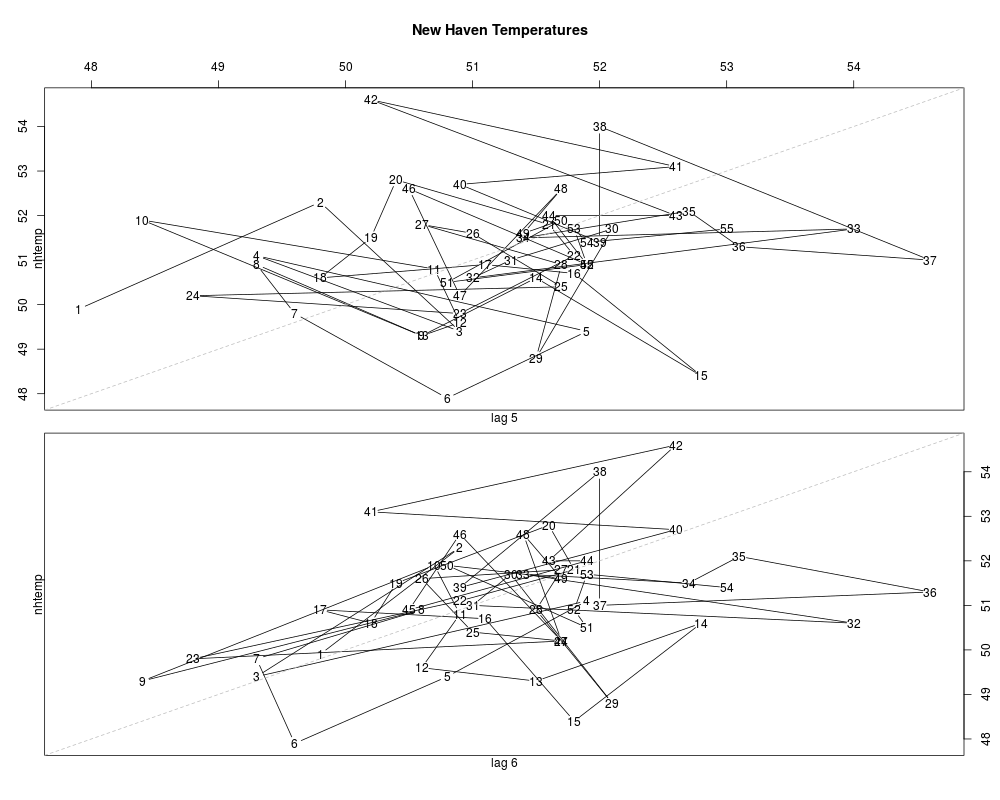
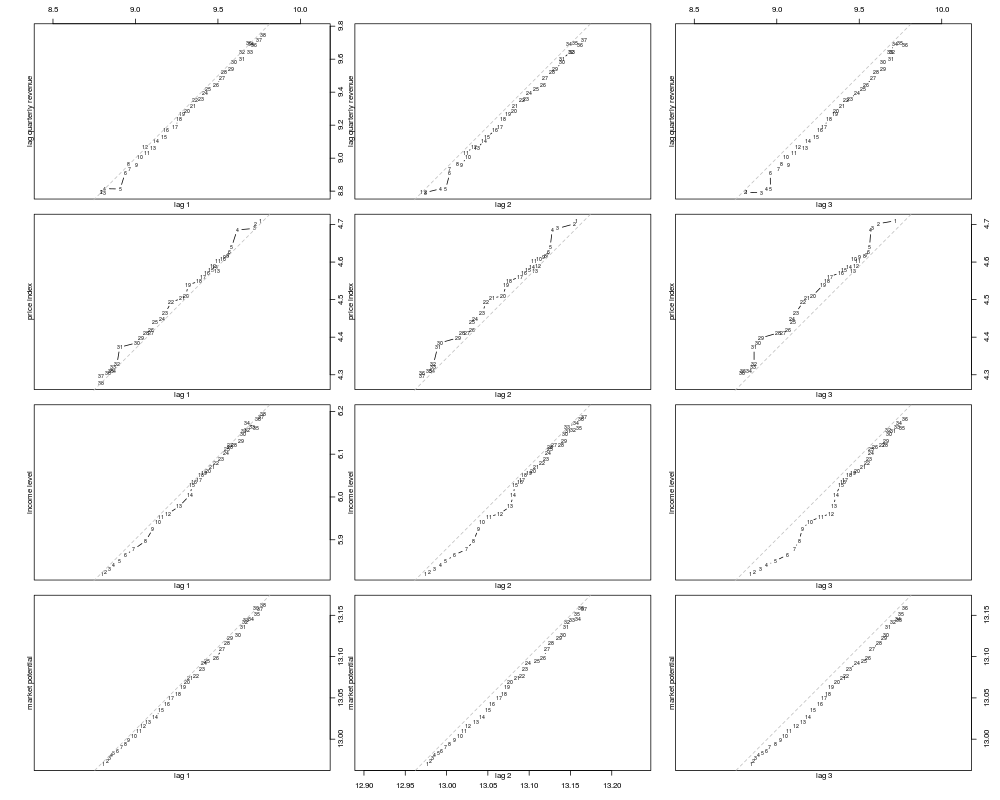
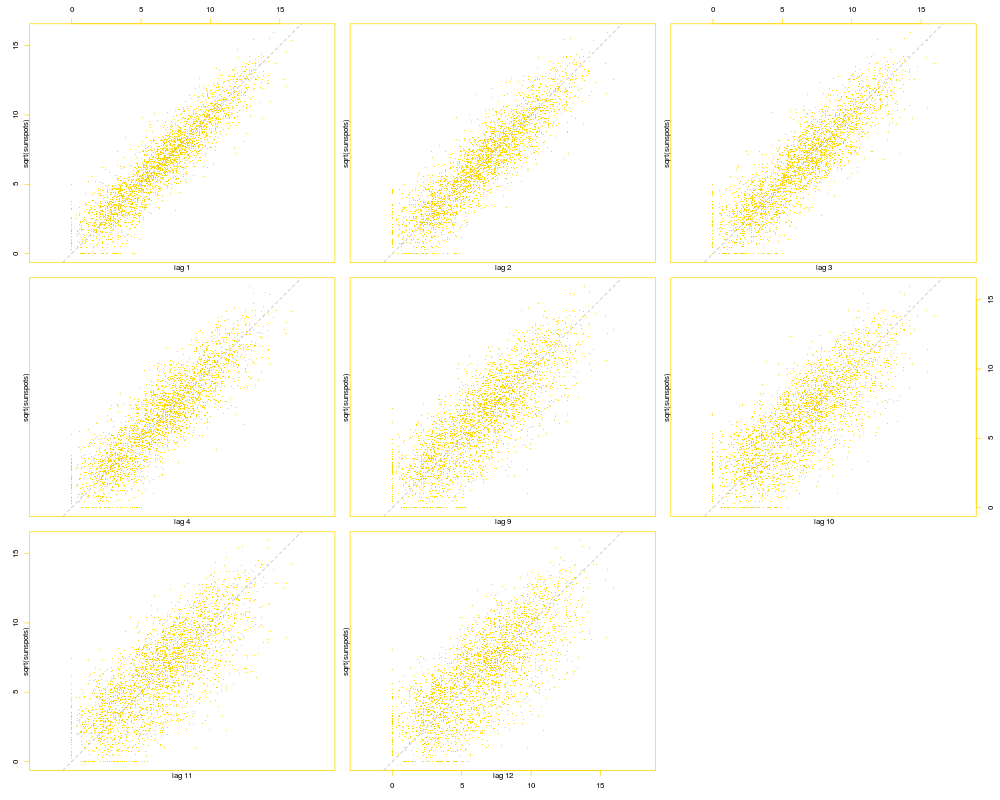
Time Series Lag PlotsDescriptionPlot time series against lagged versions of themselves. Helps visualizing ‘auto-dependence’ even when auto-correlations vanish. Usage
lag.plot(x, lags = 1, layout = NULL, set.lags = 1:lags,
         main = NULL, asp = 1,
         diag = TRUE, diag.col = "gray", type = "p", oma = NULL,
         ask = NULL, do.lines = (n <= 150), labels = do.lines,
         ...)
Arguments
DetailsIf just one plot is produced, this is a conventional plot. If more
than one plot is to be produced, If NoteIt is more flexible and has different default behaviour than
the S version. We use Author(s)Martin Maechler See Also
Examples
require(graphics)
lag.plot(nhtemp, 8, diag.col = "forest green")
lag.plot(nhtemp, 5, main = "Average Temperatures in New Haven")
## ask defaults to TRUE when we have more than one page:
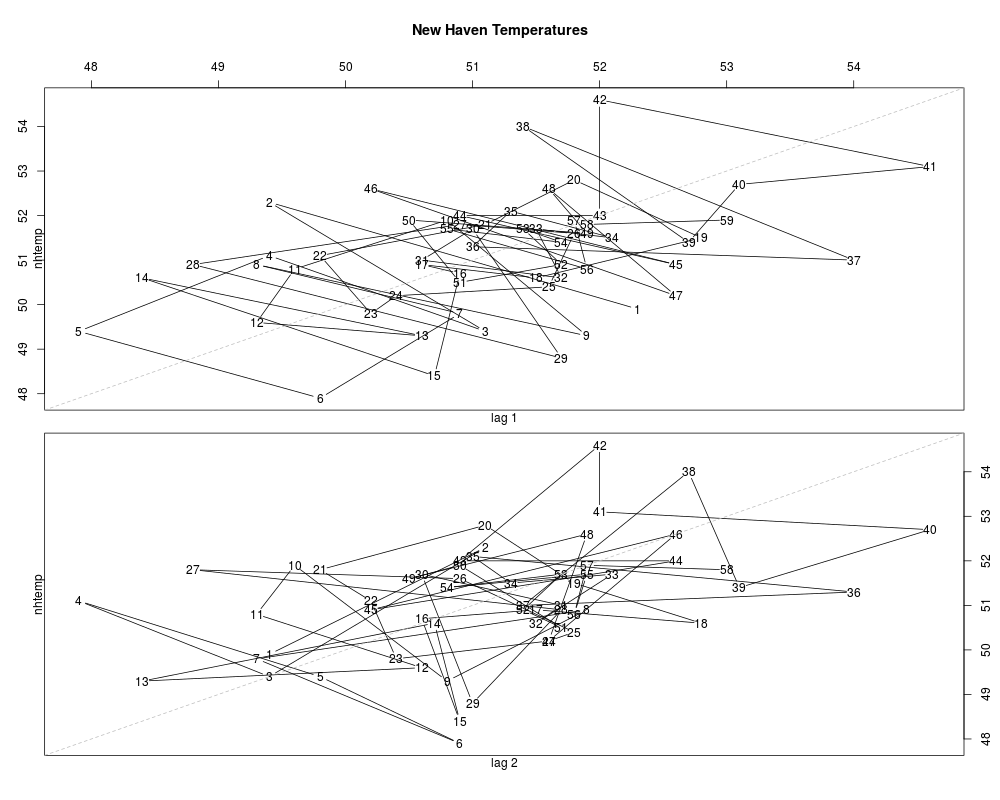
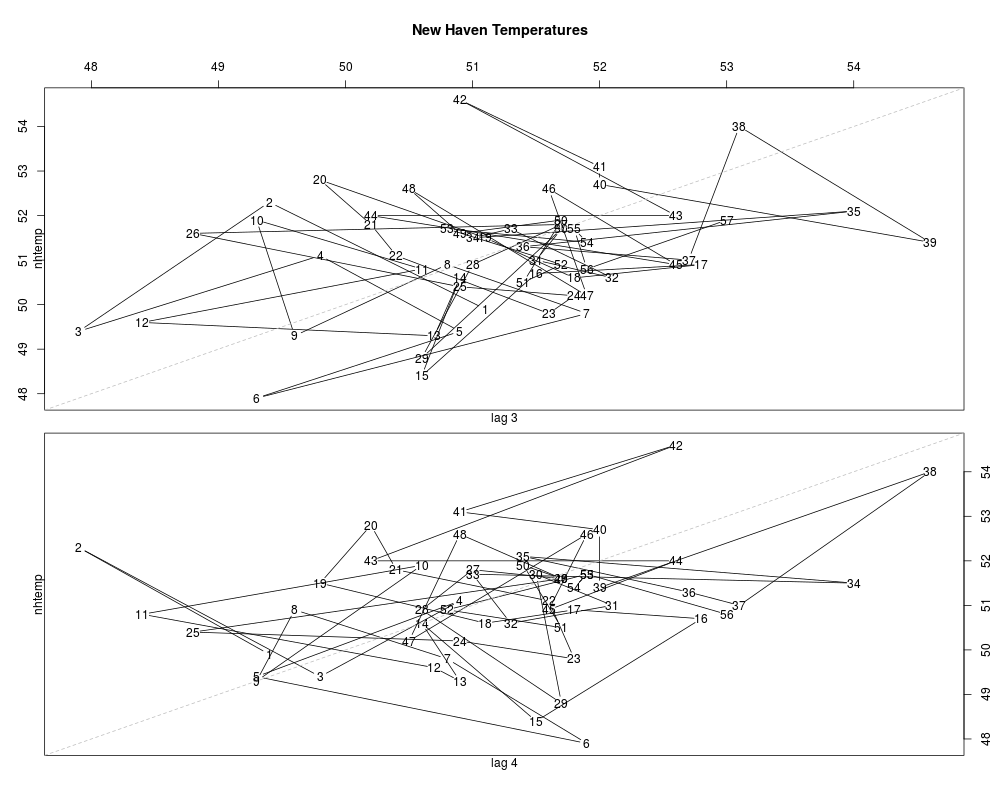
lag.plot(nhtemp, 6, layout = c(2,1), asp = NA,
main = "New Haven Temperatures", col.main = "blue")
## Multivariate (but non-stationary! ...)
lag.plot(freeny.x, lags = 3)
## no lines for long series :
lag.plot(sqrt(sunspots), set = c(1:4, 9:12), pch = ".", col = "gold")
Results
R version 3.3.1 (2016-06-21) -- "Bug in Your Hair"
Copyright (C) 2016 The R Foundation for Statistical Computing
Platform: x86_64-pc-linux-gnu (64-bit)

R is free software and comes with ABSOLUTELY NO WARRANTY.
You are welcome to redistribute it under certain conditions.
Type 'license()' or 'licence()' for distribution details.

R is a collaborative project with many contributors.
Type 'contributors()' for more information and
'citation()' on how to cite R or R packages in publications.

Type 'demo()' for some demos, 'help()' for on-line help, or
'help.start()' for an HTML browser interface to help.
Type 'q()' to quit R.

> library(stats)
> png(filename="/home/ddbj/snapshot/RGM3/R_rel/result/stats/lag.plot.Rd_%03d_medium.png", width=480, height=480)
> ### Name: lag.plot
> ### Title: Time Series Lag Plots
> ### Aliases: lag.plot
> ### Keywords: hplot ts
>
> ### ** Examples
>
> require(graphics)
>
> lag.plot(nhtemp, 8, diag.col = "forest green")
> lag.plot(nhtemp, 5, main = "Average Temperatures in New Haven")
> ## ask defaults to TRUE when we have more than one page:
> lag.plot(nhtemp, 6, layout = c(2,1), asp = NA,
+          main = "New Haven Temperatures", col.main = "blue")
>
> ## Multivariate (but non-stationary! ...)
> lag.plot(freeny.x, lags = 3)
>
> ## no lines for long series :
> lag.plot(sqrt(sunspots), set = c(1:4, 9:12), pch = ".", col = "gold")
>
>
>
>
>
> dev.off()
null device
          1
>
|