Supported by Dr. Osamu Ogasawara and  . . |
|
Last data update: 2014.03.03 |
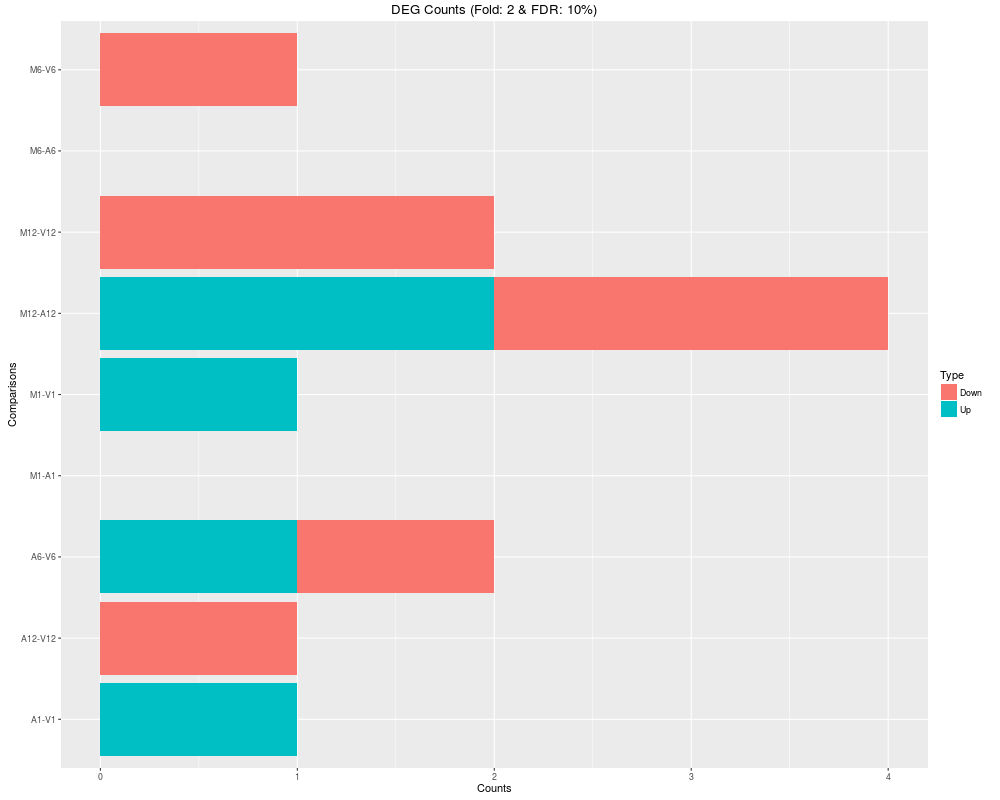
Filter and plot DEG resultsDescriptionFilters and plots DEG results for a given set of sample comparisons. The gene idenifiers of all (i) Up_or_Down, (ii) Up and (iii) Down regulated genes are stored as separate list components, while the corresponding summary statistics, stored in a fourth list component, is plotted in form of a stacked bar plot. UsagefilterDEGs(degDF, filter, plot = TRUE) Arguments
DetailsCurrently, there is no community standard available how to calculate fold
changes (here logFC) of genomic ranges, such as gene or feature ranges, to
unambiguously refer to them as features with increased or decreased read
abundandce; or in case of gene expression experiments to up or down regulated
genes, respectively. To be consistent within ValueReturns
Author(s)Thomas Girke See Also
Examples
targetspath <- system.file("extdata", "targets.txt", package="systemPipeR")
targets <- read.delim(targetspath, comment="#")
cmp <- readComp(file=targetspath, format="matrix", delim="-")
countfile <- system.file("extdata", "countDFeByg.xls", package="systemPipeR")
countDF <- read.delim(countfile, row.names=1)
edgeDF <- run_edgeR(countDF=countDF, targets=targets, cmp=cmp[[1]], independent=FALSE, mdsplot="")
pval <- edgeDF[, grep("_FDR$", colnames(edgeDF)), drop=FALSE]
fold <- edgeDF[, grep("_logFC$", colnames(edgeDF)), drop=FALSE]
DEG_list <- filterDEGs(degDF=edgeDF, filter=c(Fold=2, FDR=10))
names(DEG_list)
DEG_list$Summary
Results
R version 3.3.1 (2016-06-21) -- "Bug in Your Hair"
Copyright (C) 2016 The R Foundation for Statistical Computing
Platform: x86_64-pc-linux-gnu (64-bit)

R is free software and comes with ABSOLUTELY NO WARRANTY.
You are welcome to redistribute it under certain conditions.
Type 'license()' or 'licence()' for distribution details.

R is a collaborative project with many contributors.
Type 'contributors()' for more information and
'citation()' on how to cite R or R packages in publications.

Type 'demo()' for some demos, 'help()' for on-line help, or
'help.start()' for an HTML browser interface to help.
Type 'q()' to quit R.

> library(systemPipeR)
Loading required package: Rsamtools
Loading required package: GenomeInfoDb
Loading required package: stats4
Loading required package: BiocGenerics
Loading required package: parallel

Attaching package: 'BiocGenerics'

The following objects are masked from 'package:parallel':

    clusterApply, clusterApplyLB, clusterCall, clusterEvalQ,
    clusterExport, clusterMap, parApply, parCapply, parLapply,
    parLapplyLB, parRapply, parSapply, parSapplyLB

The following objects are masked from 'package:stats':

    IQR, mad, xtabs

The following objects are masked from 'package:base':

    Filter, Find, Map, Position, Reduce, anyDuplicated, append,
    as.data.frame, cbind, colnames, do.call, duplicated, eval, evalq,
    get, grep, grepl, intersect, is.unsorted, lapply, lengths, mapply,
    match, mget, order, paste, pmax, pmax.int, pmin, pmin.int, rank,
    rbind, rownames, sapply, setdiff, sort, table, tapply, union,
    unique, unsplit

Loading required package: S4Vectors

Attaching package: 'S4Vectors'

The following objects are masked from 'package:base':

    colMeans, colSums, expand.grid, rowMeans, rowSums

Loading required package: IRanges
Loading required package: GenomicRanges
Loading required package: Biostrings
Loading required package: XVector
Loading required package: ShortRead
Loading required package: BiocParallel
Loading required package: GenomicAlignments
Loading required package: SummarizedExperiment
Loading required package: Biobase
Welcome to Bioconductor

    Vignettes contain introductory material; view with
    'browseVignettes()'. To cite Bioconductor, see
    'citation("Biobase")', and for packages 'citation("pkgname")'.


> png(filename="/home/ddbj/snapshot/RGM3/R_BC/result/systemPipeR/filterDEGs.Rd_%03d_medium.png", width=480, height=480)
> ### Name: filterDEGs
> ### Title: Filter and plot DEG results
> ### Aliases: filterDEGs
> ### Keywords: utilities
>
> ### ** Examples
>
> targetspath <- system.file("extdata", "targets.txt", package="systemPipeR")
> targets <- read.delim(targetspath, comment="#")
> cmp <- readComp(file=targetspath, format="matrix", delim="-")
> countfile <- system.file("extdata", "countDFeByg.xls", package="systemPipeR")
> countDF <- read.delim(countfile, row.names=1)
> edgeDF <- run_edgeR(countDF=countDF, targets=targets, cmp=cmp[[1]], independent=FALSE, mdsplot="")
Disp = 0.20653 , BCV = 0.4545
> pval <- edgeDF[, grep("_FDR$", colnames(edgeDF)), drop=FALSE]
> fold <- edgeDF[, grep("_logFC$", colnames(edgeDF)), drop=FALSE]
> DEG_list <- filterDEGs(degDF=edgeDF, filter=c(Fold=2, FDR=10))
> names(DEG_list)
[1] "UporDown" "Up"       "Down"     "Summary"
> DEG_list$Summary
        Comparisons Counts_Up_or_Down Counts_Up Counts_Down
M1-A1         M1-A1                 0         0           0
M1-V1         M1-V1                 1         1           0
A1-V1         A1-V1                 1         1           0
M6-A6         M6-A6                 0         0           0
M6-V6         M6-V6                 1         0           1
A6-V6         A6-V6                 2         1           1
M12-A12     M12-A12                 4         2           2
M12-V12     M12-V12                 2         0           2
A12-V12     A12-V12                 1         0           1
>
>
>
>
>
> dev.off()
null device
          1
>
|