Supported by Dr. Osamu Ogasawara and  . . |
|
Last data update: 2014.03.03 |
Diagnostic functions for topGOdata and topGOresult objects.DescriptionThe The The UsageGenTable(object, ...) showGroupDensity(object, whichGO, ranks = FALSE, rm.one = TRUE) printGenes(object, whichTerms, file, ...) Arguments
Details
Note: One needs to type the complete attribute names (the exact name)
of this function, like: The
One or more GO identifiers can be given to the function using the
The function has a argument For the moment the function will work only when the chip used has an annotation package available in Bioconductor. It will not work with other type of custom annotations. ValueA data.frame or a list of data.fames. Author(s)Adrian Alexa See Also
Examples
data(GOdata)
########################################
## GenTable
########################################
## load two topGOresult sample objects: resultFisher and resultKS
data(results.tGO)
## generate the result of Fisher's exact test
sig.tab <- GenTable(GOdata, Fis = resultFisher, topNodes = 20)
## results of both test
sig.tab <- GenTable(GOdata, resultFisher, resultKS, topNodes = 20)
## results of both test with specified names
sig.tab <- GenTable(GOdata, Fis = resultFisher, KS = resultKS, topNodes = 20)
## results of both test with specified names and specified ordering
sig.tab <- GenTable(GOdata, Fis = resultFisher, KS = resultKS, orderBy = "KS", ranksOf = "Fis", topNodes = 20)
########################################
## showGroupDensity
########################################
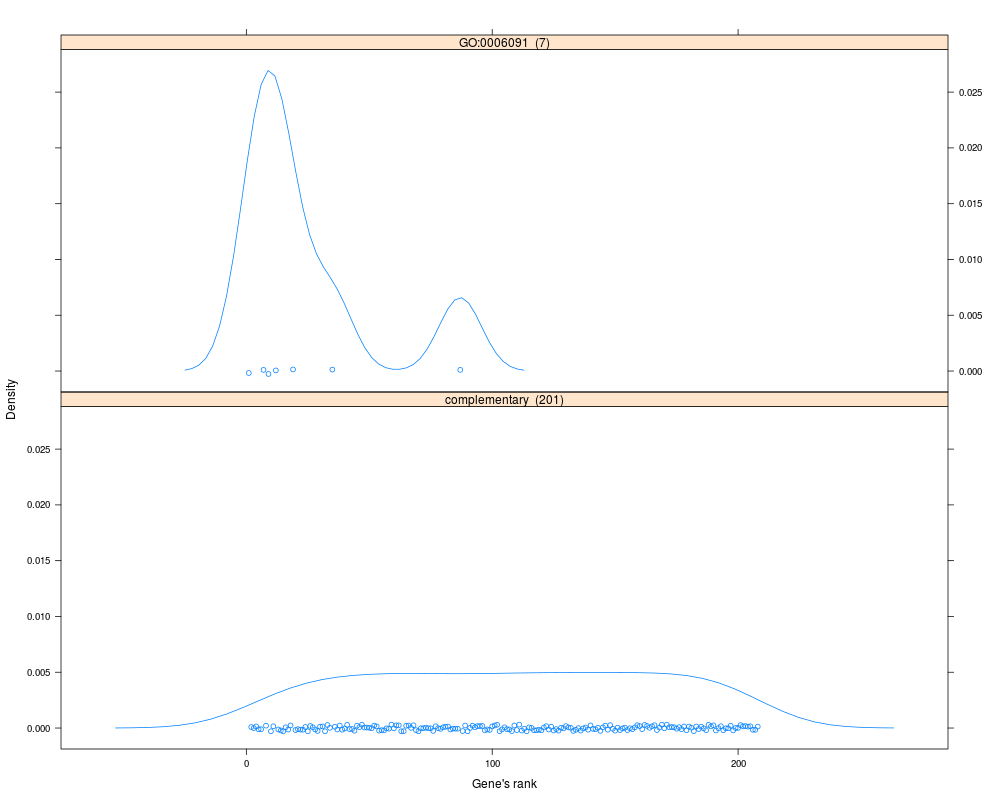
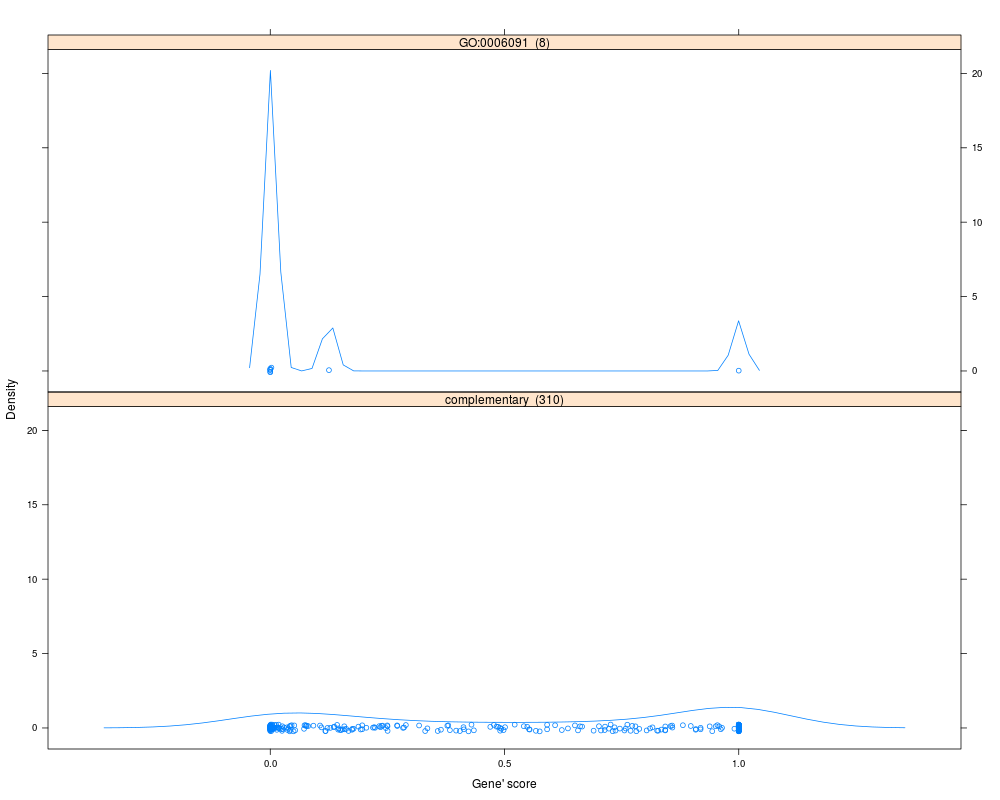
goID <- "GO:0006091"
print(showGroupDensity(GOdata, goID, ranks = TRUE))
print(showGroupDensity(GOdata, goID, ranks = FALSE, rm.one = FALSE))
########################################
## printGenes
########################################
## Not run:
library(hgu95av2.db)
goID <- "GO:0006629"
gt <- printGenes(GOdata, whichTerms = goID, chip = "hgu95av2.db", numChar = 40)
goIDs <- c("GO:0006629", "GO:0007076")
gt <- printGenes(GOdata, whichTerms = goIDs, chip = "hgu95av2.db", pvalCutOff = 0.01)
gt[goIDs[1]]
## End(Not run)
Results
R version 3.3.1 (2016-06-21) -- "Bug in Your Hair"
Copyright (C) 2016 The R Foundation for Statistical Computing
Platform: x86_64-pc-linux-gnu (64-bit)

R is free software and comes with ABSOLUTELY NO WARRANTY.
You are welcome to redistribute it under certain conditions.
Type 'license()' or 'licence()' for distribution details.

R is a collaborative project with many contributors.
Type 'contributors()' for more information and
'citation()' on how to cite R or R packages in publications.

Type 'demo()' for some demos, 'help()' for on-line help, or
'help.start()' for an HTML browser interface to help.
Type 'q()' to quit R.

> library(topGO)
Loading required package: BiocGenerics
Loading required package: parallel

Attaching package: 'BiocGenerics'

The following objects are masked from 'package:parallel':

    clusterApply, clusterApplyLB, clusterCall, clusterEvalQ,
    clusterExport, clusterMap, parApply, parCapply, parLapply,
    parLapplyLB, parRapply, parSapply, parSapplyLB

The following objects are masked from 'package:stats':

    IQR, mad, xtabs

The following objects are masked from 'package:base':

    Filter, Find, Map, Position, Reduce, anyDuplicated, append,
    as.data.frame, cbind, colnames, do.call, duplicated, eval, evalq,
    get, grep, grepl, intersect, is.unsorted, lapply, lengths, mapply,
    match, mget, order, paste, pmax, pmax.int, pmin, pmin.int, rank,
    rbind, rownames, sapply, setdiff, sort, table, tapply, union,
    unique, unsplit

Loading required package: graph
Loading required package: Biobase
Welcome to Bioconductor

    Vignettes contain introductory material; view with
    'browseVignettes()'. To cite Bioconductor, see
    'citation("Biobase")', and for packages 'citation("pkgname")'.

Loading required package: GO.db
Loading required package: AnnotationDbi
Loading required package: stats4
Loading required package: IRanges
Loading required package: S4Vectors

Attaching package: 'S4Vectors'

The following objects are masked from 'package:base':

    colMeans, colSums, expand.grid, rowMeans, rowSums


Loading required package: SparseM

Attaching package: 'SparseM'

The following object is masked from 'package:base':

    backsolve


groupGOTerms: 	GOBPTerm, GOMFTerm, GOCCTerm environments built.

Attaching package: 'topGO'

The following object is masked from 'package:IRanges':

    members

> png(filename="/home/ddbj/snapshot/RGM3/R_BC/result/topGO/diagnosticMethods.Rd_%03d_medium.png", width=480, height=480)
> ### Name: dignostic-methods
> ### Title: Diagnostic functions for topGOdata and topGOresult objects.
> ### Aliases: printGenes-methods printGenes
> ###   printGenes,topGOdata,character,character-method
> ###   printGenes,topGOdata,character,missing-method GenTable
> ###   GenTable,topGOdata-method showGroupDensity
> ### Keywords: methods
>
> ### ** Examples
>
>
> data(GOdata)
>
>
> ########################################
> ## GenTable
> ########################################
>
> ## load two topGOresult sample objects: resultFisher and resultKS
> data(results.tGO)
>
> ## generate the result of Fisher's exact test
> sig.tab <- GenTable(GOdata, Fis = resultFisher, topNodes = 20)
>
> ## results of both test
> sig.tab <- GenTable(GOdata, resultFisher, resultKS, topNodes = 20)
>
> ## results of both test with specified names
> sig.tab <- GenTable(GOdata, Fis = resultFisher, KS = resultKS, topNodes = 20)
>
> ## results of both test with specified names and specified ordering
> sig.tab <- GenTable(GOdata, Fis = resultFisher, KS = resultKS, orderBy = "KS", ranksOf = "Fis", topNodes = 20)
>
>
> ########################################
> ## showGroupDensity
> ########################################
>
> goID <- "GO:0006091"
> print(showGroupDensity(GOdata, goID, ranks = TRUE))
> print(showGroupDensity(GOdata, goID, ranks = FALSE, rm.one = FALSE))
>
>
>
> ########################################
> ## printGenes
> ########################################
>
> ## Not run:
> ##D library(hgu95av2.db)
> ##D goID <- "GO:0006629"
> ##D
> ##D gt <- printGenes(GOdata, whichTerms = goID, chip = "hgu95av2.db", numChar = 40)
> ##D
> ##D goIDs <- c("GO:0006629", "GO:0007076")
> ##D gt <- printGenes(GOdata, whichTerms = goIDs, chip = "hgu95av2.db", pvalCutOff = 0.01)
> ##D
> ##D gt[goIDs[1]]
> ## End(Not run)
>
>
>
>
>
> dev.off()
null device
          1
>
|