Supported by Dr. Osamu Ogasawara and  . . |
|
Last data update: 2014.03.03 |
Class "topGOdata"DescriptionTODO: The node attributes are environments containing the genes/probes annotated to the respective node If genes is a numeric vector than this should represent the gene's score. If it is factor it should discriminate the genes in interesting genes and the rest TODO: it will be a good idea to replace the allGenes and allScore with an ExpressionSet class. In this way we can use tests like global test, globalAncova.... – ALL variables starting with . are just for internal class usage (private) Objects from the ClassObjects can be created by calls of the form Slots
Methods
Author(s)Adrian Alexa See Also
Examples
## load the dataset
data(geneList)
library(package = affyLib, character.only = TRUE)
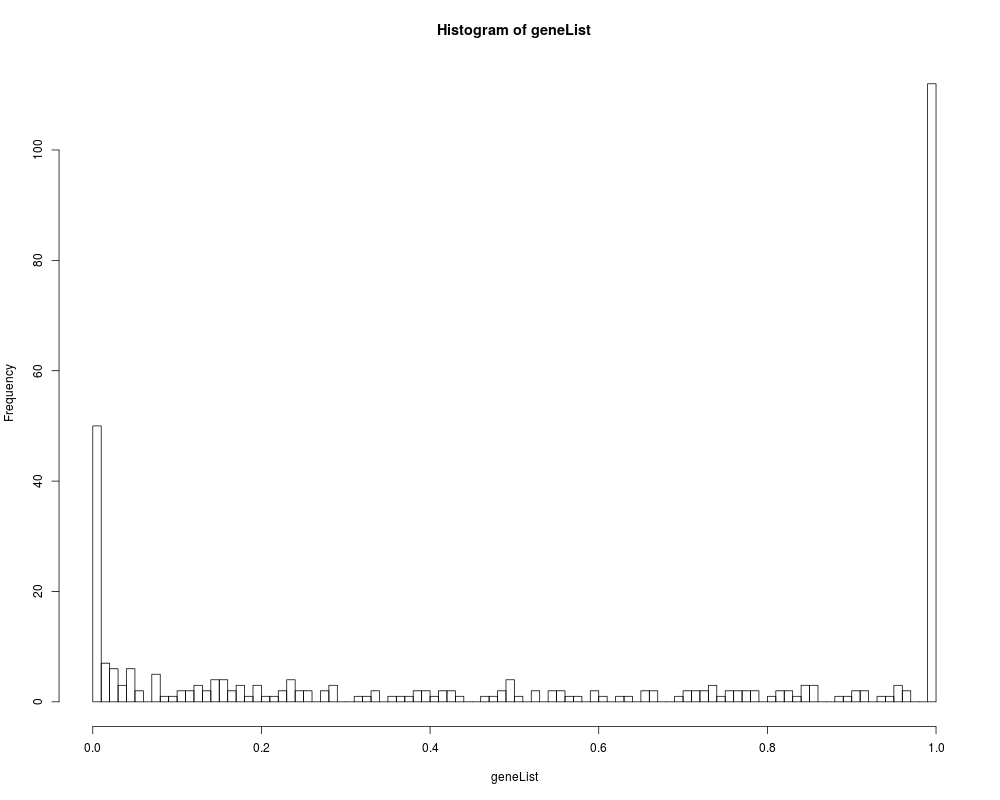
## the distribution of the adjusted p-values
hist(geneList, 100)
## how many differentially expressed genes are:
sum(topDiffGenes(geneList))
## build the topGOdata class
GOdata <- new("topGOdata",
ontology = "BP",
allGenes = geneList,
geneSel = topDiffGenes,
description = "GO analysis of ALL data: Differential Expression between B-cell and T-cell",
annot = annFUN.db,
affyLib = affyLib)
## display the GOdata object
GOdata
##########################################################
## Examples on how to use the methods
##########################################################
## description of the experiment
description(GOdata)
## obtain the genes that will be used in the analysis
a <- genes(GOdata)
str(a)
numGenes(GOdata)
## obtain the score (p-value) of the genes
selGenes <- names(geneList)[sample(1:length(geneList), 10)]
gs <- geneScore(GOdata, whichGenes = selGenes)
print(gs)
## if we want an unnamed vector containing all the feasible genes
gs <- geneScore(GOdata, use.names = FALSE)
str(gs)
## the list of significant genes
sg <- sigGenes(GOdata)
str(sg)
numSigGenes(GOdata)
## to update the gene list
.geneList <- geneScore(GOdata, use.names = TRUE)
GOdata ## more available genes
GOdata <- updateGenes(GOdata, .geneList, topDiffGenes)
GOdata ## the available genes are now the feasible genes
## the available GO terms (all the nodes in the graph)
go <- usedGO(GOdata)
length(go)
## to list the genes annotated to a set of specified GO terms
sel.terms <- sample(go, 10)
ann.genes <- genesInTerm(GOdata, sel.terms)
str(ann.genes)
## the score for these genes
ann.score <- scoresInTerm(GOdata, sel.terms)
str(ann.score)
## to see the number of annotated genes
num.ann.genes <- countGenesInTerm(GOdata)
str(num.ann.genes)
## to summarise the statistics
termStat(GOdata, sel.terms)
Results
R version 3.3.1 (2016-06-21) -- "Bug in Your Hair"
Copyright (C) 2016 The R Foundation for Statistical Computing
Platform: x86_64-pc-linux-gnu (64-bit)

R is free software and comes with ABSOLUTELY NO WARRANTY.
You are welcome to redistribute it under certain conditions.
Type 'license()' or 'licence()' for distribution details.

R is a collaborative project with many contributors.
Type 'contributors()' for more information and
'citation()' on how to cite R or R packages in publications.

Type 'demo()' for some demos, 'help()' for on-line help, or
'help.start()' for an HTML browser interface to help.
Type 'q()' to quit R.

> library(topGO)
Loading required package: BiocGenerics
Loading required package: parallel

Attaching package: 'BiocGenerics'

The following objects are masked from 'package:parallel':

    clusterApply, clusterApplyLB, clusterCall, clusterEvalQ,
    clusterExport, clusterMap, parApply, parCapply, parLapply,
    parLapplyLB, parRapply, parSapply, parSapplyLB

The following objects are masked from 'package:stats':

    IQR, mad, xtabs

The following objects are masked from 'package:base':

    Filter, Find, Map, Position, Reduce, anyDuplicated, append,
    as.data.frame, cbind, colnames, do.call, duplicated, eval, evalq,
    get, grep, grepl, intersect, is.unsorted, lapply, lengths, mapply,
    match, mget, order, paste, pmax, pmax.int, pmin, pmin.int, rank,
    rbind, rownames, sapply, setdiff, sort, table, tapply, union,
    unique, unsplit

Loading required package: graph
Loading required package: Biobase
Welcome to Bioconductor

    Vignettes contain introductory material; view with
    'browseVignettes()'. To cite Bioconductor, see
    'citation("Biobase")', and for packages 'citation("pkgname")'.

Loading required package: GO.db
Loading required package: AnnotationDbi
Loading required package: stats4
Loading required package: IRanges
Loading required package: S4Vectors

Attaching package: 'S4Vectors'

The following objects are masked from 'package:base':

    colMeans, colSums, expand.grid, rowMeans, rowSums


Loading required package: SparseM

Attaching package: 'SparseM'

The following object is masked from 'package:base':

    backsolve


groupGOTerms: 	GOBPTerm, GOMFTerm, GOCCTerm environments built.

Attaching package: 'topGO'

The following object is masked from 'package:IRanges':

    members

> png(filename="/home/ddbj/snapshot/RGM3/R_BC/result/topGO/topGOdata-class.Rd_%03d_medium.png", width=480, height=480)
> ### Name: topGOdata-class
> ### Title: Class "topGOdata"
> ### Aliases: topGOdata-class allGenes attrInTerm countGenesInTerm
> ###   description<- description feasible<- feasible geneSelectionFun<-
> ###   geneSelectionFun genes genesInTerm graph<- graph numGenes ontology<-
> ###   ontology sigGenes numSigGenes termStat updateGenes updateTerm<-
> ###   usedGO expressionMatrix phenotype expressionMatrix,topGOdata-method
> ###   phenotype,topGOdata-method geneScore
> ###   geneScore,topGOdata,missing-method
> ###   geneScore,topGOdata,character-method scoresInTerm
> ###   scoresInTerm,topGOdata,missing-method
> ###   scoresInTerm,topGOdata,character-method show,topGOdata-method
> ###   allGenes,topGOdata-method
> ###   attrInTerm,topGOdata,character,character-method
> ###   attrInTerm,topGOdata,character,missing-method
> ###   countGenesInTerm,topGOdata,character-method
> ###   countGenesInTerm,topGOdata,missing-method
> ###   description<-,topGOdata,ANY-method description,topGOdata-method
> ###   feasible<-,topGOdata-method feasible,topGOdata-method
> ###   geneScore,topGOdata-method geneSelectionFun<-,topGOdata-method
> ###   geneSelectionFun,topGOdata-method genes,topGOdata-method
> ###   genesInTerm,topGOdata,character-method
> ###   genesInTerm,topGOdata,missing-method graph<-,topGOdata-method
> ###   graph,topGOdata-method initialize,topGOdata-method
> ###   numGenes,topGOdata-method ontology<-,topGOdata-method
> ###   ontology,topGOdata-method print,topGOdata-method
> ###   sigGenes,topGOdata-method numSigGenes,topGOdata-method
> ###   termStat,topGOdata,character-method termStat,topGOdata,missing-method
> ###   updateGenes,topGOdata,numeric,function-method
> ###   updateGenes,topGOdata,factor,missing-method
> ###   updateTerm<-,topGOdata,character-method usedGO,topGOdata-method
> ### Keywords: graphs classes
>
> ### ** Examples
>
> ## load the dataset
> data(geneList)
> library(package = affyLib, character.only = TRUE)
Loading required package: org.Hs.eg.db


>
> ## the distribution of the adjusted p-values
> hist(geneList, 100)
>
> ## how many differentially expressed genes are:
> sum(topDiffGenes(geneList))
[1] 50
>
> ## build the topGOdata class
> GOdata <- new("topGOdata",
+               ontology = "BP",
+               allGenes = geneList,
+               geneSel = topDiffGenes,
+               description = "GO analysis of ALL data: Differential Expression between B-cell and T-cell",
+               annot = annFUN.db,
+               affyLib = affyLib)

Building most specific GOs .....
	( 1531 GO terms found. )

Build GO DAG topology ..........
	( 4273 GO terms and 10081 relations. )

Annotating nodes ...............
	( 310 genes annotated to the GO terms. )
>
> ## display the GOdata object
> GOdata

------------------------- topGOdata object -------------------------

 Description:
   -  GO analysis of ALL data: Differential Expression between B-cell and T-cell

 Ontology:
   -  BP

 323 available genes (all genes from the array):
   - symbol:  1095_s_at 1130_at 1196_at 1329_s_at 1340_s_at  ...
   - score :  1 1 0.62238 0.541224 1  ...
   - 50  significant genes.

 310 feasible genes (genes that can be used in the analysis):
   - symbol:  1095_s_at 1130_at 1196_at 1329_s_at 1340_s_at  ...
   - score :  1 1 0.62238 0.541224 1  ...
   - 46  significant genes.

 GO graph (nodes with at least  1  genes):
   - a graph with directed edges
   - number of nodes = 4273
   - number of edges = 10081

------------------------- topGOdata object -------------------------

>
> ##########################################################
> ## Examples on how to use the methods
> ##########################################################
>
> ## description of the experiment
> description(GOdata)
[1] "GO analysis of ALL data: Differential Expression between B-cell and T-cell"
>
> ## obtain the genes that will be used in the analysis
> a <- genes(GOdata)
> str(a)
 chr [1:310] "1095_s_at" "1130_at" "1196_at" "1329_s_at" ...
> numGenes(GOdata)
[1] 310
>
> ## obtain the score (p-value) of the genes
> selGenes <- names(geneList)[sample(1:length(geneList), 10)]
> gs <- geneScore(GOdata, whichGenes = selGenes)
> print(gs)
  40520_g_at     35407_at     32074_at       759_at     31803_at     34350_at
1.391379e-04 7.228121e-01 2.191118e-03 1.000000e+00 1.000000e+00 1.000000e+00
    38114_at   38942_r_at
4.589572e-05 1.745177e-01
>
> ## if we want an unnamed vector containing all the feasible genes
> gs <- geneScore(GOdata, use.names = FALSE)
> str(gs)
 num [1:310] 1 1 0.622 0.541 1 ...
>
> ## the list of significant genes
> sg <- sigGenes(GOdata)
> str(sg)
 chr [1:46] "1347_at" "1792_g_at" "31864_at" "32074_at" ...
> numSigGenes(GOdata)
[1] 46
>
> ## to update the gene list
> .geneList <- geneScore(GOdata, use.names = TRUE)
> GOdata ## more available genes

------------------------- topGOdata object -------------------------

 Description:
   -  GO analysis of ALL data: Differential Expression between B-cell and T-cell

 Ontology:
   -  BP

 323 available genes (all genes from the array):
   - symbol:  1095_s_at 1130_at 1196_at 1329_s_at 1340_s_at  ...
   - score :  1 1 0.62238 0.541224 1  ...
   - 50  significant genes.

 310 feasible genes (genes that can be used in the analysis):
   - symbol:  1095_s_at 1130_at 1196_at 1329_s_at 1340_s_at  ...
   - score :  1 1 0.62238 0.541224 1  ...
   - 46  significant genes.

 GO graph (nodes with at least  1  genes):
   - a graph with directed edges
   - number of nodes = 4273
   - number of edges = 10081

------------------------- topGOdata object -------------------------

> GOdata <- updateGenes(GOdata, .geneList, topDiffGenes)
> GOdata ## the available genes are now the feasible genes

------------------------- topGOdata object -------------------------

 Description:
   -  GO analysis of ALL data: Differential Expression between B-cell and T-cell

 Ontology:
   -  BP

 310 available genes (all genes from the array):
   - symbol:  1095_s_at 1130_at 1196_at 1329_s_at 1340_s_at  ...
   - score :  1 1 0.62238 0.541224 1  ...
   - 46  significant genes.

 310 feasible genes (genes that can be used in the analysis):
   - symbol:  1095_s_at 1130_at 1196_at 1329_s_at 1340_s_at  ...
   - score :  1 1 0.62238 0.541224 1  ...
   - 46  significant genes.

 GO graph (nodes with at least  1  genes):
   - a graph with directed edges
   - number of nodes = 4273
   - number of edges = 10081

------------------------- topGOdata object -------------------------

>
> ## the available GO terms (all the nodes in the graph)
> go <- usedGO(GOdata)
> length(go)
[1] 4273
>
> ## to list the genes annotated to a set of specified GO terms
> sel.terms <- sample(go, 10)
> ann.genes <- genesInTerm(GOdata, sel.terms)
> str(ann.genes)
List of 10
 $ GO:0032392: chr [1:4] "1544_at" "31935_s_at" "34956_at" "40124_at"
 $ GO:0050873: chr "1069_at"
 $ GO:2000105: chr [1:2] "1792_g_at" "1833_at"
 $ GO:0009605: chr [1:82] "1069_at" "1095_s_at" "1130_at" "1165_at" ...
 $ GO:0055001: chr [1:7] "1803_at" "1945_at" "33324_s_at" "34736_at" ...
 $ GO:0014012: chr "39106_at"
 $ GO:0014896: chr [1:2] "40421_at" "40795_at"
 $ GO:1904892: chr [1:5] "1165_at" "1574_s_at" "33955_at" "33981_at" ...
 $ GO:0045926: chr [1:9] "1634_s_at" "1830_s_at" "1852_at" "258_at" ...
 $ GO:0009628: chr [1:44] "1069_at" "1544_at" "1634_s_at" "1738_at" ...
>
> ## the score for these genes
> ann.score <- scoresInTerm(GOdata, sel.terms)
> str(ann.score)
List of 10
 $ GO:0032392: num [1:4] 0.00306 0.01513 0.21927 0.76215
 $ GO:0050873: num 0.24
 $ GO:2000105: num [1:2] 0.00661 0.0251
 $ GO:0009605: num [1:82] 0.24 1 1 1 1 ...
 $ GO:0055001: num [1:7] 0.0731 0.5218 0.0513 0.3835 0.158 ...
 $ GO:0014012: num 2.66e-05
 $ GO:0014896: num [1:2] 0.158 0.0177
 $ GO:1904892: num [1:5] 1 0.1222 0.938 0.0416 1
 $ GO:0045926: num [1:9] 1 1 0.554 1 0.828 ...
 $ GO:0009628: num [1:44] 0.23987 0.00306 1 1 0.00661 ...
>
> ## to see the number of annotated genes
> num.ann.genes <- countGenesInTerm(GOdata)
> str(num.ann.genes)
 Named int [1:4273] 88 7 2 1 1 1 1 1 9 58 ...
 - attr(*, "names")= chr [1:4273] "GO:0000003" "GO:0000018" "GO:0000022" "GO:0000041" ...
>
> ## to summarise the statistics
> termStat(GOdata, sel.terms)
           Annotated Significant Expected
GO:0032392         4           1     0.59
GO:0050873         1           0     0.15
GO:2000105         2           1     0.30
GO:0009605        82          19    12.17
GO:0055001         7           0     1.04
GO:0014012         1           1     0.15
GO:0014896         2           0     0.30
GO:1904892         5           0     0.74
GO:0045926         9           0     1.34
GO:0009628        44           4     6.53
>
>
>
>
>
> dev.off()
null device
          1
>
|