A GRange object or data frame, which is GWAS trait-associated SNPs downloaded from up-to-date dbGaP and NHGRI public database. It is maintained to be updated to the latest version. The data frame contains the following columns,Trait,SNP,p.value,Chr,Position,Context,GENE_NAME,GENE_START,GENE_END,GENE_STRAND. The data frame is in data subdirectory. Users are free to add more SNP records to the data frame for practical use.
region
A data frame, which is genomic intervals with three columns, chromosome, genomic start position, genomic end position.
keyword
The keyword is used when specific trait is of interest. If keyword is specified, only the SNPs associated to the trait are used for analyses. Otherwise, all traits will be analyzed.
snpid
SNP rs number
gene
Gene name
pvalue
SNPs with p-value less than this threshold are used for analyses.
plot.type
Either "densityplot" or "boxplot"
ext
Bp extended upstream and downstream
xymax
The maximum range on x-axis and y-axis
interval
A data frame, genomic interval:chromosome, genomic start position, genomic end position
Value
plotContext
A pie plot with the distribution of SNP function class
plotPvalue
A density plot of -logPvalue of trait-associated SNPs
plotSNP
A plot of trait-associated SNP on chromosome
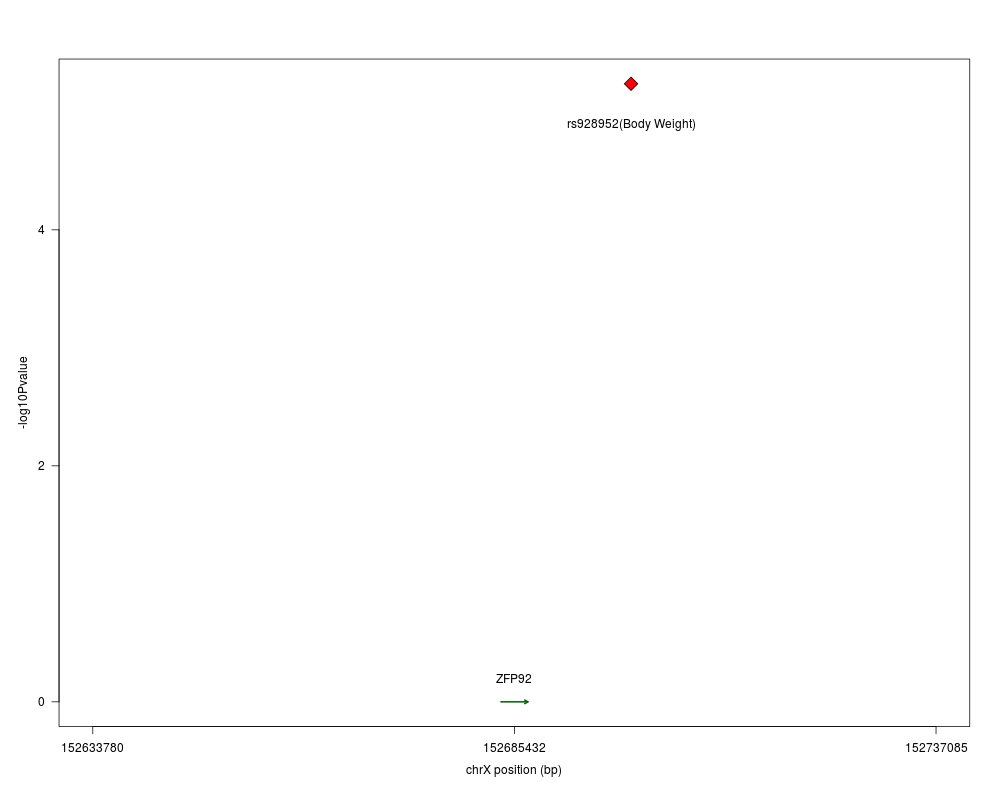
plotGene
A plot with the gene and possible nearby trait-associated SNPs
plotInterval
A plot with chromosome interval with possible nearby genes and trait-associated SNPs
Author(s)
Li Chen <li.chen@emory.edu>, Zhaohui Qin<zhaohui.qin@emory.edu>
R version 3.3.1 (2016-06-21) -- "Bug in Your Hair"
Copyright (C) 2016 The R Foundation for Statistical Computing
Platform: x86_64-pc-linux-gnu (64-bit)

R is free software and comes with ABSOLUTELY NO WARRANTY.
You are welcome to redistribute it under certain conditions.
Type 'license()' or 'licence()' for distribution details.

R is a collaborative project with many contributors.
Type 'contributors()' for more information and
'citation()' on how to cite R or R packages in publications.

Type 'demo()' for some demos, 'help()' for on-line help, or
'help.start()' for an HTML browser interface to help.
Type 'q()' to quit R.

> library(traseR)
Loading required package: GenomicRanges
Loading required package: BiocGenerics
Loading required package: parallel

Attaching package: 'BiocGenerics'

The following objects are masked from 'package:parallel':

    clusterApply, clusterApplyLB, clusterCall, clusterEvalQ,
    clusterExport, clusterMap, parApply, parCapply, parLapply,
    parLapplyLB, parRapply, parSapply, parSapplyLB

The following objects are masked from 'package:stats':

    IQR, mad, xtabs

The following objects are masked from 'package:base':

    Filter, Find, Map, Position, Reduce, anyDuplicated, append,
    as.data.frame, cbind, colnames, do.call, duplicated, eval, evalq,
    get, grep, grepl, intersect, is.unsorted, lapply, lengths, mapply,
    match, mget, order, paste, pmax, pmax.int, pmin, pmin.int, rank,
    rbind, rownames, sapply, setdiff, sort, table, tapply, union,
    unique, unsplit

Loading required package: S4Vectors
Loading required package: stats4

Attaching package: 'S4Vectors'

The following objects are masked from 'package:base':

    colMeans, colSums, expand.grid, rowMeans, rowSums

Loading required package: IRanges
Loading required package: GenomeInfoDb
Loading required package: BSgenome.Hsapiens.UCSC.hg19
Loading required package: BSgenome
Loading required package: Biostrings
Loading required package: XVector
Loading required package: rtracklayer
> png(filename="/home/ddbj/snapshot/RGM3/R_BC/result/traseR/plots.Rd_%03d_medium.png", width=480, height=480)
> ### Name: plots
> ### Title: Visualize of trait-associated SNPs
> ### Aliases: plotContext plotGene plotSNP plotPvalue plotInterval
>
> ### ** Examples
>
>
> 	data(taSNP)
> 	plotContext(snpdb= taSNP,keyword="Autoimmune")
> 	plotGene(snpdb= taSNP,gene="ZFP92",ext=50000)
> 	plotSNP(snpdb= taSNP,snpid="rs766420",ext=50000)
> 	plotInterval(snpdb= taSNP,data.frame(chr="chrX",start=152633780,end=152737085))
>
>
>
>
>
> dev.off()
null device
          1
>
 .
.