the topic which should be demonstrated, given as a
name or literal character string, or a character string,
depending on whether character.only is FALSE (default)
or TRUE. If omitted, the list of available topics is
displayed.
package
a character vector giving the packages to look into for
demos, or NULL. By default, all packages in the search path
are used.
lib.loc
a character vector of directory names of R libraries,
or NULL. The default value of NULL corresponds to all
libraries currently known. If the default is used, the loaded
packages are searched before the libraries.
character.only
logical; if TRUE, use topic as
character string.
verbose
a logical. If TRUE, additional diagnostics are
printed.
echo
a logical. If TRUE, show the R input when sourcing.
ask
a logical (or "default") indicating if
devAskNewPage(ask = TRUE) should be called before
graphical output happens from the demo code. The value
"default" (the factory-fresh default) means to ask if
echo == TRUE and the graphics device appears to be
interactive. This parameter applies both to any currently opened
device and to any devices opened by the demo code. If this is
evaluated to TRUE and the session is interactive, the
user is asked to press RETURN to start.
encoding
See source. If the package has a
declared encoding, that takes preference.
Details
If no topics are given, demo lists the available demos. The
corresponding information is returned in an object of class
"packageIQR".
See Also
source and devAskNewPage which
are called by demo.
Examples
demo() # for attached packages

## All available demos:
demo(package = .packages(all.available = TRUE))


## Display a demo, pausing between pages
demo(lm.glm, package = "stats", ask = TRUE)

## Display it without pausing
demo(lm.glm, package = "stats", ask = FALSE)


## Not run:
 ch <- "scoping"
 demo(ch, character = TRUE)

## End(Not run)

## Find the location of a demo
system.file("demo", "lm.glm.R", package = "stats")
Results
R version 3.3.1 (2016-06-21) -- "Bug in Your Hair"
Copyright (C) 2016 The R Foundation for Statistical Computing
Platform: x86_64-pc-linux-gnu (64-bit)
R is free software and comes with ABSOLUTELY NO WARRANTY.
You are welcome to redistribute it under certain conditions.
Type 'license()' or 'licence()' for distribution details.
R is a collaborative project with many contributors.
Type 'contributors()' for more information and
'citation()' on how to cite R or R packages in publications.
Type 'demo()' for some demos, 'help()' for on-line help, or
'help.start()' for an HTML browser interface to help.
Type 'q()' to quit R.
> library(utils)
> png(filename="/home/ddbj/snapshot/RGM3/R_rel/result/utils/demo.Rd_%03d_medium.png", width=480, height=480)
> ### Name: demo
> ### Title: Demonstrations of R Functionality
> ### Aliases: demo
> ### Keywords: documentation utilities
>
> ### ** Examples
>
> demo() # for attached packages
Demos in package 'base':
error.catching More examples on catching and handling errors
is.things Explore some properties of R objects and
is.FOO() functions. Not for newbies!
recursion Using recursion for adaptive integration
scoping An illustration of lexical scoping.
Demos in package 'grDevices':
colors A show of R's predefined colors()
hclColors Exploration of hcl() space
Demos in package 'graphics':
Hershey Tables of the characters in the Hershey vector
fonts
Japanese Tables of the Japanese characters in the
Hershey vector fonts
graphics A show of some of R's graphics capabilities
image The image-like graphics builtins of R
persp Extended persp() examples
plotmath Examples of the use of mathematics annotation
Demos in package 'stats':
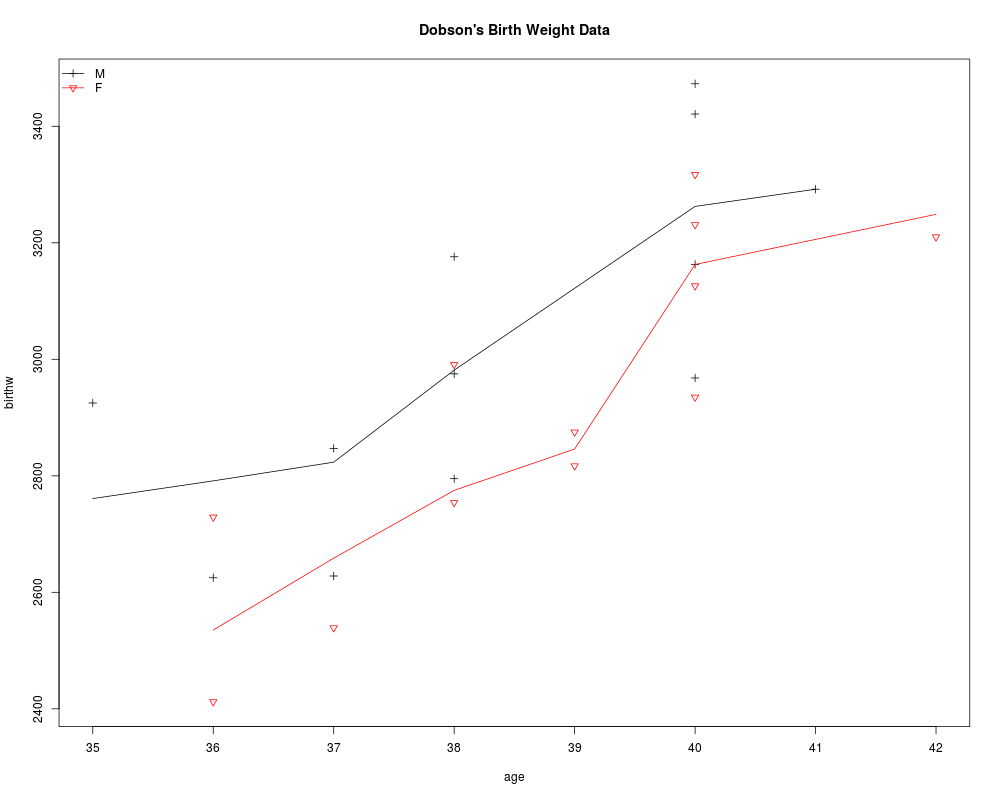
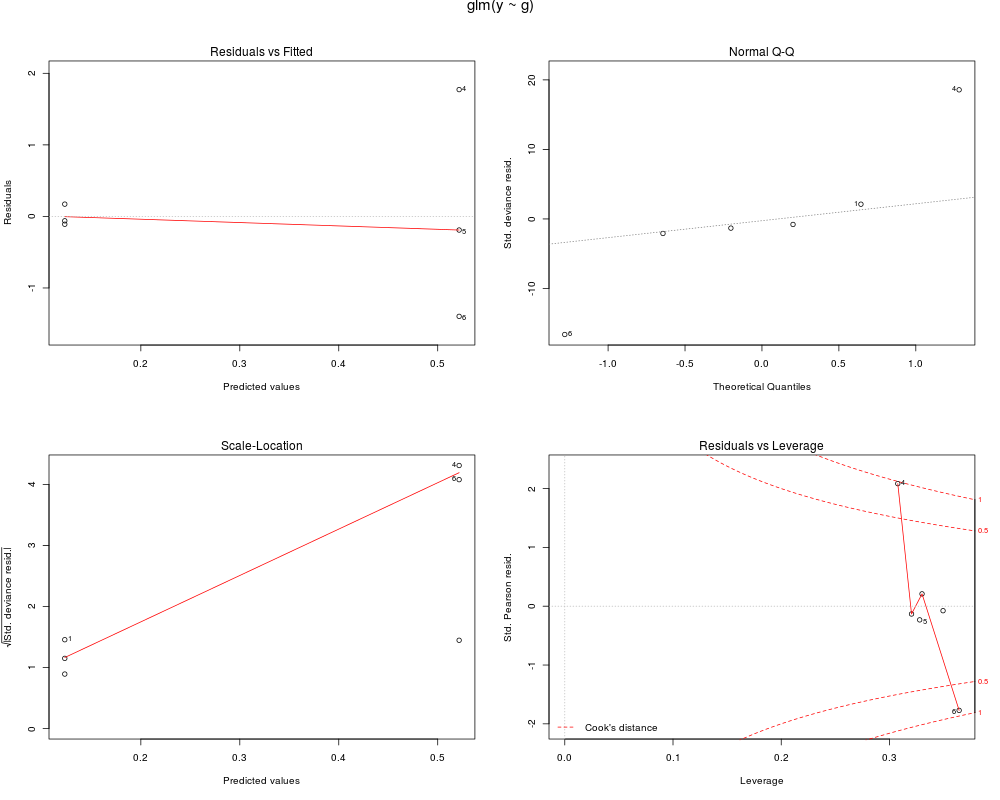
glm.vr Some glm() examples from V&R with several
predictors
lm.glm Some linear and generalized linear modelling
examples from `An Introduction to Statistical
Modelling' by Annette Dobson
nlm Nonlinear least-squares using nlm()
smooth `Visualize' steps in Tukey's smoothers
Use 'demo(package = .packages(all.available = TRUE))'
to list the demos in all *available* packages.
>
> ## All available demos:
> demo(package = .packages(all.available = TRUE))
Demos in package 'ABCoptim':
ABCoptim ABC optimization demos
Demos in package 'AER':
Ch-Basics Chapter 2: Basics
Ch-Intro Chapter 1: Introduction
Ch-LinearRegression Chapter 3: Linear Regression
Ch-Microeconometrics Chapter 5: Models of Microeconometrics
Ch-Programming Chapter 7: Programming Your Own Analysis
Ch-TimeSeries Chapter 6: Time Series
Ch-Validation Chapter 4: Diagnostics and Alternative Methods
of Regression
Demos in package 'ARPobservation':
CDR_reliability Plot illustrating the reliability of continuous
recording data
MTS_measurands Plots illustrating the two possible measurands
for momentary time sampling data
PIR_bias Plot illustrating the bias of partial interval
recording data as a function of incidence
study_planning Simulate hypothetical ABAB designs in order to
assess which measurement strategy to use
Demos in package 'AdMit':
AdMit Examples of the AdMit approach and functions
provided by the package AdMit.
Demos in package 'AmericanCallOpt':
example Examples of option pricing functions with
sample parameter inputs.
Demos in package 'AquaEnv':
DSAdynamicmodel an example of a dynamic pH model according to
the DSA (Hofmann2008) and fractional
stoichiometry (Hofmann et al. in prep.) using
AquaEnv
TAfitting examples for usage of the AquaEnv function
TAfit
basicfeatures introducing the basic features of AquaEnv
dynamicmodel an example of a dynamic model using AquaEnv
pHmodelling1_implicit_method
dynamic model using AquaEnv: implicit pH
modelling
pHmodelling2_explicit_method
dynamic model using AquaEnv: explicit pH
modelling (Hofmann2008, DSA)
pHmodelling3_fractional_stoichiometry
dynamic model using AquaEnv: fractional
stoichiometry (Hofmann et al. in prep.)
titration examples for the usage of the AquaEnv function
titration
Demos in package 'BAS':
BAS.USCrime BMA using the UScrime data
BAS.hald BMA using the hald data with 4 variables
Demos in package 'BB':
multiStart Examples using multiStart to start BBsolve at
different initial guesses
nlmin Examples of spg, sane, dfsane with optim
comparisons
nlsolve Simple examples to illustrate sane, dfsane
Demos in package 'BGLR':
BA BayesA
BB BayesB
BL Bayesian LASSO
BRR Bayesian Ridge Regression
BRR_windows Bayesian Ridge Regression with sliding windows
BayesC BayesC-pi
Bernoulli Probit regression
RKHS Reproducing kernel Hilbert spaces
RKHS_KA Reproducing kernel Hilbert spaces with kernel
averaging
censored Regression for censored samples
ordinal Ordinal regression
read_bed Read a BED file
read_ped Read a PED file
write_bed Write a BED file
Demos in package 'BLR':
cross_validation Cross validation
fit_bL Bayesian LASSO
Demos in package 'BMS':
BMS.growth Interactive demo: basic BMA applications
Demos in package 'BNDataGenerator':
asia BN structure learning using bnlearn with asia
topology BN structure learning using bnlearn with
topology
Demos in package 'BTSPAS':
demo-TSPDE-WHchinook Time Stratified Petersen with Diagonal Entries
separating YoY Wild vs Hatchery chinook fish
demo-TSPDE-WHchinook2 Time Stratified Petersen with Non-Diagonal
Entries, YoY and Age1 Chinook Fish
demo-TSPDE-WHsteel Time Stratified Petersen with Diagaonal Entries
separating YoY and age 1+ Hatchery vs Wild
Steelhead
demo-TSPDE-cov Time Stratified Petersen with Diagonal Entries
with covariates for logit(p)
demo-TSPDE-error Error messages when calling TSPDE
demo-TSPDE-spline-in-logitP
Time Stratified Petersen with Diagonal Entries
and spline fit to logit P
demo-TSPDE Time Stratified Petersen with Diagonal Entries
demo-TSPNDE-conne-2009
Time Stratified Petersen with Non-Diagonal
Entries, log-normal model of the travel times,
and some p(j) fixed to zero
demo-TSPNDE Time Stratified Petesen with Non-Diagonal
Entries
demo-TSPNDENP-conne-2009-prior-movement
Time Stratified Petersen with Non-Diagonal
Entries, Non-parametric model of travl times,
some p(j) fixed to zero, and prior
specification on movement.
demo-TSPNDENP-conne-2009
Time Stratified Petersen with Non-Diagonal
Entries, Non-Parametric model of the travel
times, and some p(j) fixed to zero
demo-TSPNDENP-error Error messages when calling
TimeStratPetersenNonDiagErrorNP_fit
demo-TSPNDENP-fall-back
Time Stratified Petersen with Non-Diagonal
Entries, Non-parametric model of travl times,
some p(j) fixed to zero, and prior
specification on movement; adjustment for
estimated fall back allowed after release.
demo-TSPNDENP-small-prior-movement
Time Stratified Petersen with Non-Diagonal
Entries, Non-parameteric model with prior info
on movement. Small model for quick testing.
demo-TSPNDENP-small Time Stratified Petersen with Non-Diagonal
Entries, Non-parameteric model. Small model for
quick testing.
Demos in package 'BTYD':
bgbb_donations Demonstration of BG/BB estimation and plotting
functions
bgnbd_cdnow Demonstration of BG/NBD estimation and plotting
functions
pnbd_cdnow Demonstration of Pareto/NBD estimation and
plotting functions
spend_cdnow Demonstration of gamma-gamma (spend model)
estimation and plotting functions
Demos in package 'BayesBridge':
all Run various functions in BayesBridge package.
Demos in package 'BayesVarSel':
BayesVarSel.Hald Bayesian Variable Selection over the hald data
with 4 variables
Demos in package 'BiasedUrn':
ApproxHypergeo Compares different noncentral hypergeometric
distributions with same mean rather than same
odds
CompareHypergeo Compares different noncentral hypergeometric
distributions
OddsPrecision Measures precision of odds function
SampleWallenius Makes random variates from Wallenius noncentral
hypergeometric distribution
UrnTheory Vignette explaining the distributions of biased
sampling
Demos in package 'Bmix':
DPreg DP regression with categorical and continuous
covariates (both PL and Gibbs)
alpha changing concentration parameter example
bar1D Dynamic BAR stick-breaking mixture density
estimation in 1-D
bar2D Dynamic BAR stick-breaking mixture density
estimation in 2-D
pines Pine-trees example
Demos in package 'Bolstad2':
BayesCPH Bayesian Cox Proportional Hazard model
BayesLogisticReg Bayesian Logistic Regression
BayesPoissonReg Bayesian Poisson Regression
hiermeanReg Hierarchical Modelling
normGibbs Gibbs sampling from a normal distribution
Demos in package 'CCAGFA':
CCAGFAexample Illustration of the CCA/BIBFA/GFA model on
simulated data
Demos in package 'CDNmoney':
MonetaryAggregates Show calculation of Canadian monetary
aggregates from component data
Demos in package 'CHCN':
CreateCHCN Download everything.
Demos in package 'CHNOSZ':
NaCl equilibrium constant for aqueous NaCl
dissociation
ORP oxidation-reduction potential of redox
standards as a function of temperature
buffer ionized proteins as a chemical activity buffer
(1. thiol peroxidases 2. sigma factors)
copper another example of mosaic(): complexation of
copper with glycine species
dehydration log K of dehydration reactions; SVG file
contains tooltips and links
density density of H2O, inverted from IAPWS-95
equations
findit detailed example of usage of findit()
ionize ionize.aa(): contour plots of net charge and
ionization properties of LYSC_CHICK
mosaic Eh-pH diagram for iron oxides, sulfides and
carbonate with two sets of changing basis
species
nucleobase relative stabilities of nucleobases and some
amino acids
revisit detailed example of usage of revisit()
solubility solubility of calcite or CO2(gas) as a function
of pH
sources cross-check the reference list with the
thermodynamic database
wjd run.wjd() with proteins: cell periphery of
yeast
yeastgfp logfO2-logaH2O diagrams for model proteins
based on YeastGFP localizations
Demos in package 'CIDnetworks':
dolphin A fitting demonstration with the Dolphin social
network.
Demos in package 'CPE':
phcpe demonstration of CPE package
Demos in package 'CRM':
crm demonstration of crm function
crmsim demonstration of crm simulator
Demos in package 'ChainLadder':
ChainLadder Overview of the ChainLadder package
DatabaseExamples Demo showing how the ChainLadder package can be
used in connection with a database, e.g. Access
MSOffice Demo showing how R and ChainLadder can be used
for auto reporting
MackChainLadder Detailed demo of the MackChainLadder function
MultiChainLadder Detailed demo of the MultiChainLadder function
clarkDemo Demo of David Clark's "LDF" and "Cape Cod"
methods (functions 'ClarkLDF' and
'ClarkCapeCod', respectively)
Demos in package 'ChemometricsWithR':
chapter10 Scripts from Chapter 10
chapter11 Scripts from Chapter 11
chapter2 Scripts from Chapter 2
chapter3 Scripts from Chapter 3
chapter4 Scripts from Chapter 4
chapter5 Scripts from Chapter 5
chapter6 Scripts from Chapter 6
chapter7 Scripts from Chapter 7
chapter8 Scripts from Chapter 8
chapter9 Scripts from Chapter 9
Demos in package 'ClickClust':
BackwardSelection ClickClust Backward state selection
ClickPlot1 ClickClust Constructing click-plot 1
ClickPlot2 ClickClust Constructing click-plot 2
ConfidenceIntervals ClickClust Confidence intervals calculation
DataSimulation ClickClust Shows how to simulate data
EMalgorithm1 ClickClust EM algorithm without initial state
probabilities
EMalgorithm2 ClickClust EM algorithm with initial state
probabilities
ForwardSelection ClickClust Forward state selection
ReadData ClickClust Shows how to read data
StatePrediction ClickClust State prediction
demoClickClust ClickClust Tests main functions
msnbc323 ClickClust Analysis of msnbc323 dataset
utility ClickClust Illustrative example
Demos in package 'CollocInfer':
ChemoEx Sample Example System from Chemostat
predator-predy dynamics.
ChemoRMEx Real world data from chemostat experiments fit
to the Rosenzweig-MacArthur data.
FhN.diagnostics Sample diagnostics for model building
FhNEx2 Sample Continous System FitzHugh-Nagumo
HenonEx Sample Discrete System Henon Map
NorthShore Sample Forced Linear System of groundwater from
Vancouver's North Shore
RMEx Sample Example Rosensweig-MacArthur system with
two prey species
SEIREX Sample partially observed SEIR system measured
on the log scale
Demos in package 'CompareCausalNetworks':
simulation Simulates a data set and runs various methods
on it.
Demos in package 'CondReg':
compare_wealth Code for comparing wealth growth of investing
with different strategies
Demos in package 'DATforDCEMRI':
DAT Analyzes a simulated data set with the
DAT.checkData and DAT functions
Demos in package 'DEoptim':
DEoptim some examples of the DEoptim function.
benchmarks some common optimization benchmarks, comparing
various strategies (e.g. DE vs. JADE)
Demos in package 'DFIT':
IPR Shows the working of the functions that relate
to the Item Parameter Replication Monte Carlo
procedure
IRTSE Shows the working of the functions that relate
to asymptotic covariance of IRT item estimates
MantelHaenszel Shows the working of the functions that relate
to the Mantel-Haenszel statistic when an
underlying IRT model is assumed to hold
NCDIF Shows the working of the functions that relate
to the DFIT indices (NCDIF, CDIF and DTF)
RajuAreas Shows the working of the functions that
calculate Raju's Signed and Unsigned Area
Measures for DIF
powerExample Shows how to calculate power for the NCDIF
index with the functions in the DFIT package.
It also shows how to use them to assess the
bias of NCDIF estimates.
Demos in package 'DNAcopy':
DNAcopy Demo of DNAcopy package analysis and plotting
capabilities
Demos in package 'DeconRNASeq':
DeconRNASeq An application of DeconRNASeq to two example
data: one is from the data set with 10 mixing
samples from five different tissues, the other
is GSE19830
Demos in package 'DendSer':
fib Fibroblast data
pottery Pottery data
sleep Sleep data
toy Toy data
Demos in package 'DescTools':
describe demonstrates some of the descriptive
capabilities of DescTools
plots shows how to create some special plots
Demos in package 'DiceEval':
IRSN5D DiceEval in use on a 5 dimensional example
provided by IRSN
Demos in package 'DiffusionRgqd':
first.passage How to generate first passage time densities
for time inhomogeneous quadratic diffusion
processes.
transition.density How to generate transition densities for
quadratic diffusions using DiffusionRgqd.
Demos in package 'DistatisR':
demoDistatisRAbdi2005 Analyzes the distances between 6 faces computed
by 4 algorithms
demoDistatisRAbdiSortingTask2007
Analyzes the data of a sorting task from Abdi
et al. 2007 Sorting Beer experiments
Demos in package 'DivE':
Example_Script example of two workflows, using DiveMaster and
using the component functions. It collates the
examples in the documentation in one place.
Demos in package 'EBMAforecast':
EBMAforecast Ensemble forecasting of civil conflict in the
Pacific rim
presForecast Ensemble forecasting of U.S. Presidential
elections
Demos in package 'EBSeq':
EBSeq demo
Demos in package 'EBSeqHMM':
EBSeqHMM demo
Demos in package 'EBarrays':
ebarrays Simple Usage of EBarrays functions
Demos in package 'EBcoexpress':
EBcoexpress An application of EBcoexpress to an example
data set with 30 genes
Demos in package 'EDR':
edr_ex0 Example with one dimensional EDR
edr_ex1 Example with one dimensional EDR
edr_ex2 Example with 2-dimensional EDR
edr_ex3 A more complicated example with 2-dimensional
EDR
edr_ex4 Example with 2-dimensional EDR and estimation
of MSEP and MAEP by edrcv
Demos in package 'EGRET':
FlowHistory Examples of flow history plots
WRTDSanalysis Examples of plots for checking WRTDS model
results
checkData Examples of plots for checking data
Demos in package 'EMCluster':
RRand EMCluster Test RRand().
allinit EMCluster Test all initialization method.
allinit_ss EMCluster Test for semi-supervised clustering.
emcluster EMCluster Test emclust() with emgroup().
emstep EMCluster Test e.step() and m.step().
lmt EMCluster Test likelihood mixture test, lmt().
logit EMCluster Test for logit of post z and mixing
proportion.
myiris EMCluster Test iris data set.
ppcontour EMCluster Test for project.on.2d() and
plotppcontour().
shortem EMCluster Test shortemcluster().
starts_via_svd EMCluster Test a function starts.via.svd().
Demos in package 'EditImputeCont':
example a complete example
Demos in package 'EvalEst':
eval.estimation Show some methods for evaluating estimation
algorithms
Demos in package 'FAOSTAT':
FAOSTATdemo Demonstration for the FAOSTAT package
Demos in package 'FDb.InfiniumMethylation.hg18':
FDb.InfiniumMethylation.hg18
R code showing how the package was built
GenomicRangesToFeatureDb
R function to turn a GRanges into a FeatureDb
hm27.SNP.colors Color-to-allele mapping for the hm27 SNP
control probes
Demos in package 'FDb.InfiniumMethylation.hg19':
FDb.InfiniumMethylation.hg19
R code showing how the package was built
GenomicRangesToFeatureDb
R function to turn a GRanges into a FeatureDb
hm27.SNP.colors Color-to-allele mapping for the hm27 SNP
control probes
Demos in package 'FKF':
FKF-Ex shows usage of FKF package
Demos in package 'FastGP':
FastGPdemo Examples and benchmarks of main matrix
operations and elliptical slice sampling in
FastGP.
Demos in package 'FinancialInstrument':
FIdemo2 FinancialInstrument more ways to define
instruments
demo FinancialInstrument demo
Demos in package 'FisherEM':
FisherEM runs the demo of the main function of FisherEM.
Demos in package 'GEOmap':
GMAP Shows examples of GEOmap
WMAP Shows examples of GEOmap
geolcoso Geology of Coso Geothermal field
weathermap Wethermap with two fronts
Demos in package 'GGMselect':
convertGraph Execution of convertGraph
penalty Execution of penalty
selectFast Execution of selectFast
selectMyFam Execution of selectMyFam
selectQE Execution of selectQE
simulateGraph Execution of simulateGraph
Demos in package 'GLAD':
tkdaglad Graphical user interface to analyze array CGH
data.
tkglad Graphical user interface to analyze array CGH
data.
Demos in package 'GMD':
GMD-demo demo script for the package `GMD'
Demos in package 'GMMBoost':
OrdinalBoost-knee The analysis of knee data using the
OrdinalBoost function.
bGAMM-soccer The analysis of soccer data using the bGAMM
function.
Demos in package 'GPFDA':
co2 Real data example of Gaussian Process, three
different covariance structure, including one
customized covariance matrix.
gpfr Gaussian Process with functional mean.
gpr_ex1 First exmaple of Gaussian Process, using only
one covariate. (linear + pow.ex)
gpr_ex2 Second exmaple of Gaussian Process, using two
covariate with larger sample size. (linear +
pow.ex)
Demos in package 'GSIF':
cookfarm_3DT_RF 3D+T random forests (regression) applied to the
cookfarm data set
cookfarm_3DT_kriging 3D+T kriging applied to the cookfarm data set
Demos in package 'GaDiFPT':
Logistic R example script for the package GaDiFPT:
generic diffusion with time-dependent
coefficients through a constant boundary
OrnUhl R example script for the package GaDiFPT:
Ornstein-Uhlenbeck process through a constant
boundary
OrnUhlCurrent R example script for the package GaDiFPT:
Ornstein-Uhlenbeck process with additional
current through a constant boundary
Wiener R example script for the package GaDiFPT:
Wiener process through a constant boundary
Wiener1 R example script for the package GaDiFPT:
Wiener process through a periodic boundary
WienerDrift R example script for the package GaDiFPT:
Wiener process with drift through a linear
boundary
Demos in package 'GenABEL':
ge03d2 Demonstrate functionality of GenABEL using data
on 1000 cases/controls typed for ~8,000 SNPs
across 3 chromosomes
ge03d2ex Exercise for the students of Ge03 (day 2)
srdta Demonstrate functionality of GenABEL using data
for a 2.5 Mb region
srdtawin The same as srdta, but starts with data(srdta)
as under Windows one could have no writing
rights
Demos in package 'GillespieSSA':
GillespieSSA GillespieSSA demonstration (running all demos
below)
decayingDimer Decaying-Dimerization Reaction Set model
epiChain SIRS metapopulation model
linearChain Linear-chain model
logisticGrowth Logistic growth model (Pearl-Verhulst model)
lotka Lotka predator-prey model
radioactiveDecay Radioactive decay model (Irreversible
isomerization reaction set)
rma Rosenzweig-MacArthur predator-prey model
sir Kermack-McKendrick SIR model
Demos in package 'HDclassif':
HDclassif Runs the demo of the two main functions of
HDclassif.
hdda A simple example of HDDA using the 'wine'
dataset.
hddc An example of clustering on the Crabs dataset.
The clustering process is also shown using a
PCA representation of the data.
Demos in package 'HELP':
pipeline Pipeline for analysis of cytosine methylation
data generated by the HELP assay
Demos in package 'HH':
MMC.README citation for MMC (Mean--mean Multiple
Comparisons plot)
MMC.WoodEnergy-aov aov in both S-Plus and R. Block factor,
treatment factor, and covariate.
MMC.WoodEnergy MMC plots in both S-Plus and R. Run
demo("MMC.WoodEnergy-aov") first.
MMC.WoodEnergy.s MMC plots from article, only in S-Plus.
MMC.apple interaction of treatment factor and covariate
MMC.catalystm one factor with orthogonal contrasts.
Construction of MMC plot
MMC.cc176 three factors and covariate
MMC.pulmonary one factor with orthogonal contrasts.
sufficient statistics
NTplot All 22 possibilities for the normal plot
(limited here to just the one-sided with
alternative="greater").
PoorChildren Count of Poor Children, by Child's Poorness,
Number of Working Parents, Concentration of
Poor Households
ancova This demo produces a composite graph
illustrating four models with a factor and a
covariate.
appleAncova A composite graph for a blocked analysis of
covariance illustrating six models with a
response, covariate, treatment factor, and
blocking factor.
arima.sim.XYZ HH Exercises 18.1 18.2 18
 .
.