Supported by Dr. Osamu Ogasawara and  . . |
|
Last data update: 2014.03.03 |
Run an Examples Section from the Online HelpDescriptionRun all the R code from the Examples part of R's online help
topic Usage
example(topic, package = NULL, lib.loc = NULL,
        character.only = FALSE, give.lines = FALSE, local = FALSE,
        echo = TRUE, verbose = getOption("verbose"),
        setRNG = FALSE, ask = getOption("example.ask"),
        prompt.prefix = abbreviate(topic, 6),
        run.dontrun = FALSE, run.donttest = interactive())
Arguments
DetailsIf An attempt is made to load the package before running the examples, but this will not replace a package loaded from another location. If As detailed in the manual Writing R Extensions, the author of the help page can markup parts of the examples for exception rules
ValueThe value of the last evaluated expression, unless Author(s)Martin Maechler and others See Also
Examples
example(InsectSprays)
## force use of the standard package 'stats':
example("smooth", package = "stats", lib.loc = .Library)

## set RNG *before* example as when R CMD check is run:

r1 <- example(quantile, setRNG = TRUE)
x1 <- rnorm(1)
u <- runif(1)
## identical random numbers
r2 <- example(quantile, setRNG = TRUE)
x2 <- rnorm(1)
stopifnot(identical(r1, r2))
## but x1 and x2 differ since the RNG state from before example()
## differs and is restored!
x1; x2

## Exploring examples code:
## How large are the examples of "lm...()" functions?
lmex <- sapply(apropos("^lm", mode = "function"),
               example, character.only = TRUE, give.lines = TRUE)
sapply(lmex, length)
Results
R version 3.3.1 (2016-06-21) -- "Bug in Your Hair"
Copyright (C) 2016 The R Foundation for Statistical Computing
Platform: x86_64-pc-linux-gnu (64-bit)
R is free software and comes with ABSOLUTELY NO WARRANTY.
You are welcome to redistribute it under certain conditions.
Type 'license()' or 'licence()' for distribution details.
R is a collaborative project with many contributors.
Type 'contributors()' for more information and
'citation()' on how to cite R or R packages in publications.
Type 'demo()' for some demos, 'help()' for on-line help, or
'help.start()' for an HTML browser interface to help.
Type 'q()' to quit R.
> library(utils)
> png(filename="/home/ddbj/snapshot/RGM3/R_rel/result/utils/example.Rd_%03d_medium.png", width=480, height=480)
> ### Name: example
> ### Title: Run an Examples Section from the Online Help
> ### Aliases: example
> ### Keywords: documentation utilities
>
> ### ** Examples
>
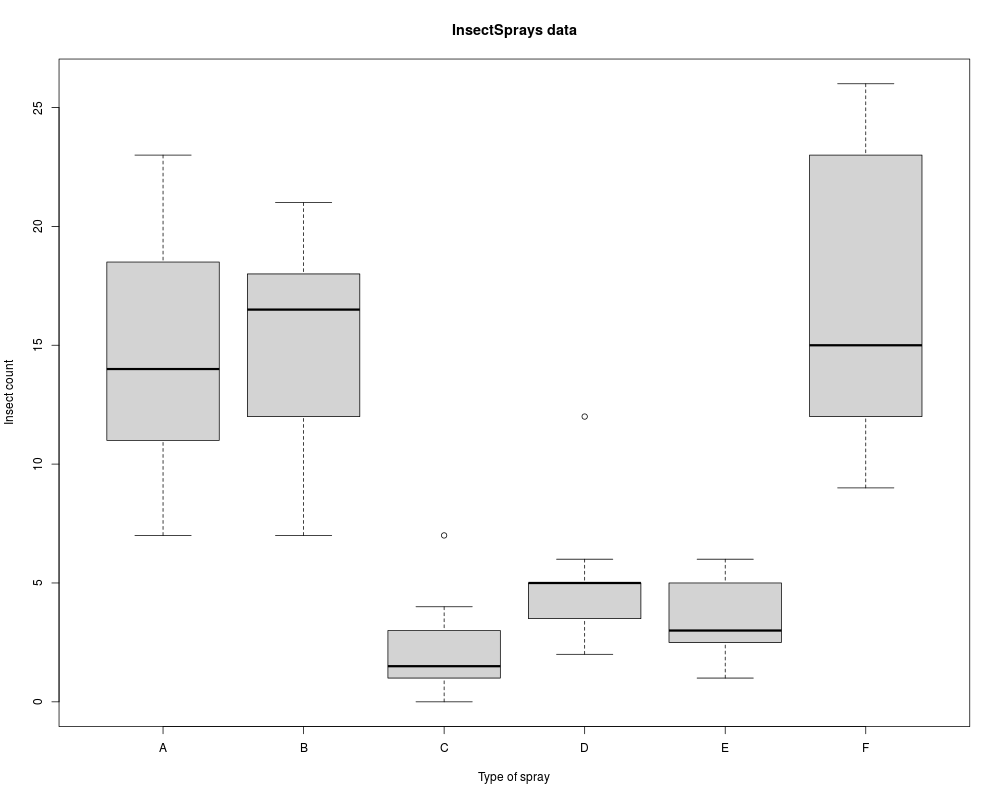
> example(InsectSprays)
InsctS> require(stats); require(graphics)
InsctS> boxplot(count ~ spray, data = InsectSprays,
InsctS+ xlab = "Type of spray", ylab = "Insect count",
InsctS+ main = "InsectSprays data", varwidth = TRUE, col = "lightgray")
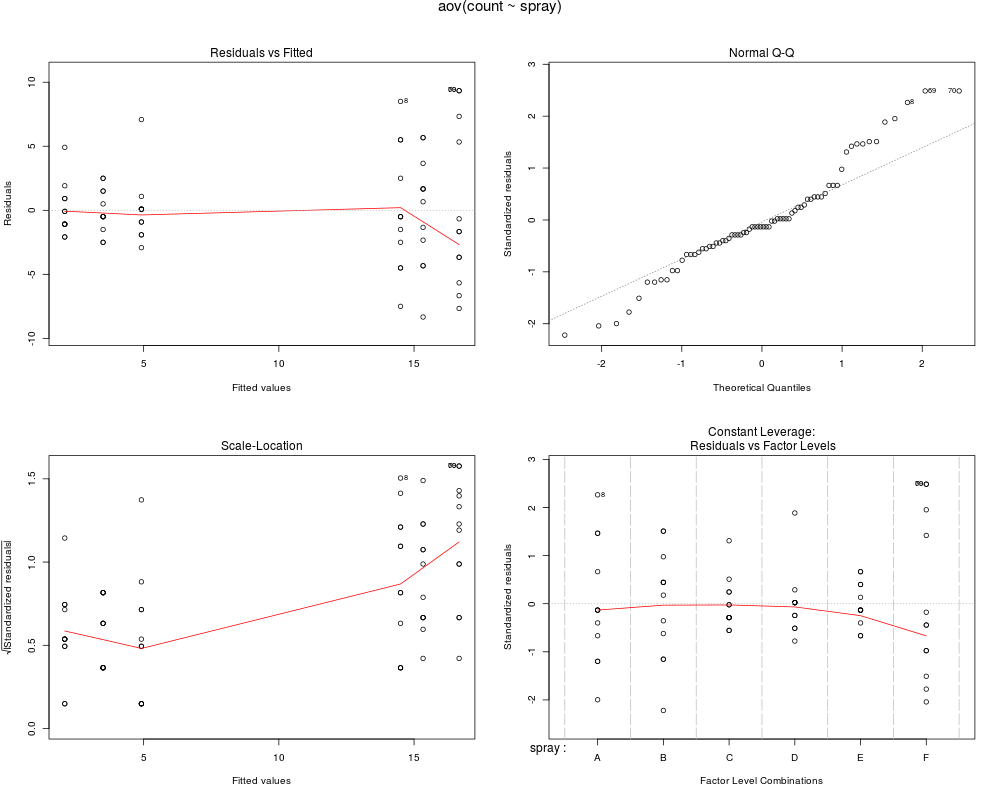
InsctS> fm1 <- aov(count ~ spray, data = InsectSprays)
InsctS> summary(fm1)
Df Sum Sq Mean Sq F value Pr(>F)
spray 5 2669 533.8 34.7 <2e-16 ***
Residuals 66 1015 15.4
---
Signif. codes: 0 '***' 0.001 '**' 0.01 '*' 0.05 '.' 0.1 ' ' 1
InsctS> opar <- par(mfrow = c(2, 2), oma = c(0, 0, 1.1, 0))
InsctS> plot(fm1)
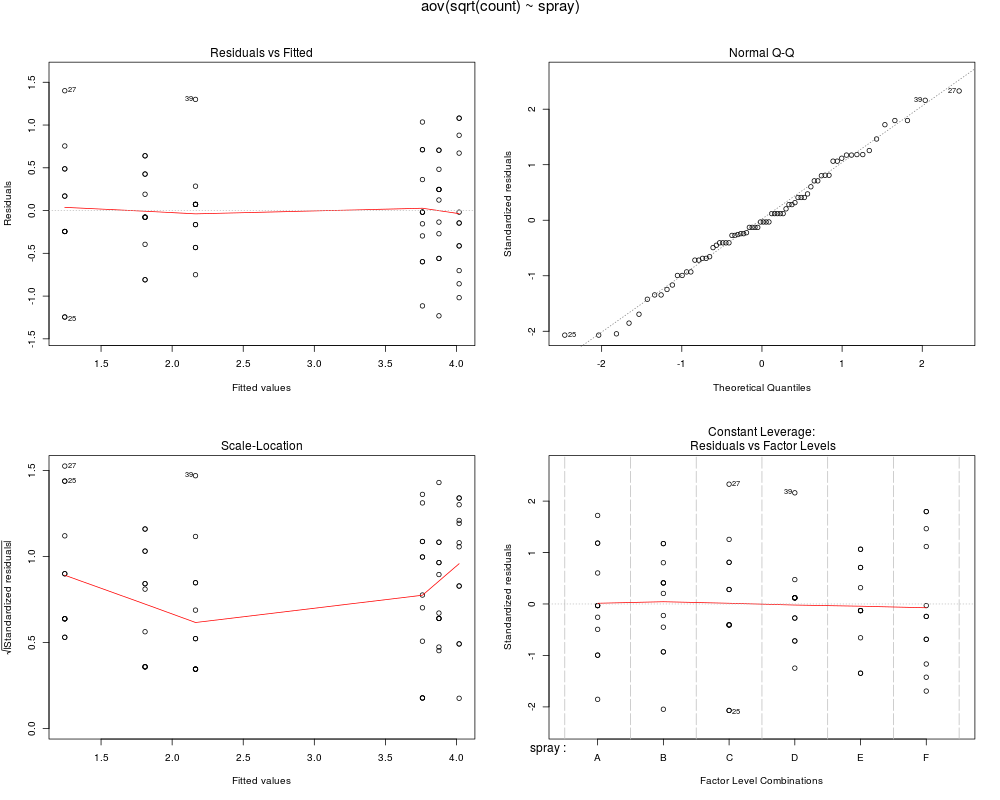
InsctS> fm2 <- aov(sqrt(count) ~ spray, data = InsectSprays)
InsctS> summary(fm2)
Df Sum Sq Mean Sq F value Pr(>F)
spray 5 88.44 17.688 44.8 <2e-16 ***
Residuals 66 26.06 0.395
---
Signif. codes: 0 '***' 0.001 '**' 0.01 '*' 0.05 '.' 0.1 ' ' 1
InsctS> plot(fm2)
InsctS> par(opar)
> ## force use of the standard package 'stats':
> example("smooth", package = "stats", lib.loc = .Library)
smooth> require(graphics)
smooth> ## see also demo(smooth) !
smooth>
smooth> x1 <- c(4, 1, 3, 6, 6, 4, 1, 6, 2, 4, 2) # very artificial
smooth> (x3R <- smooth(x1, "3R")) # 2 iterations of "3"
3R Tukey smoother resulting from smooth(x = x1, kind = "3R")
used 2 iterations
[1] 3 3 3 6 6 4 4 4 2 2 2
smooth> smooth(x3R, kind = "S")
S Tukey smoother resulting from smooth(x = x3R, kind = "S")
changed
[1] 3 3 3 3 4 4 4 4 2 2 2
smooth> sm.3RS <- function(x, ...)
smooth+ smooth(smooth(x, "3R", ...), "S", ...)
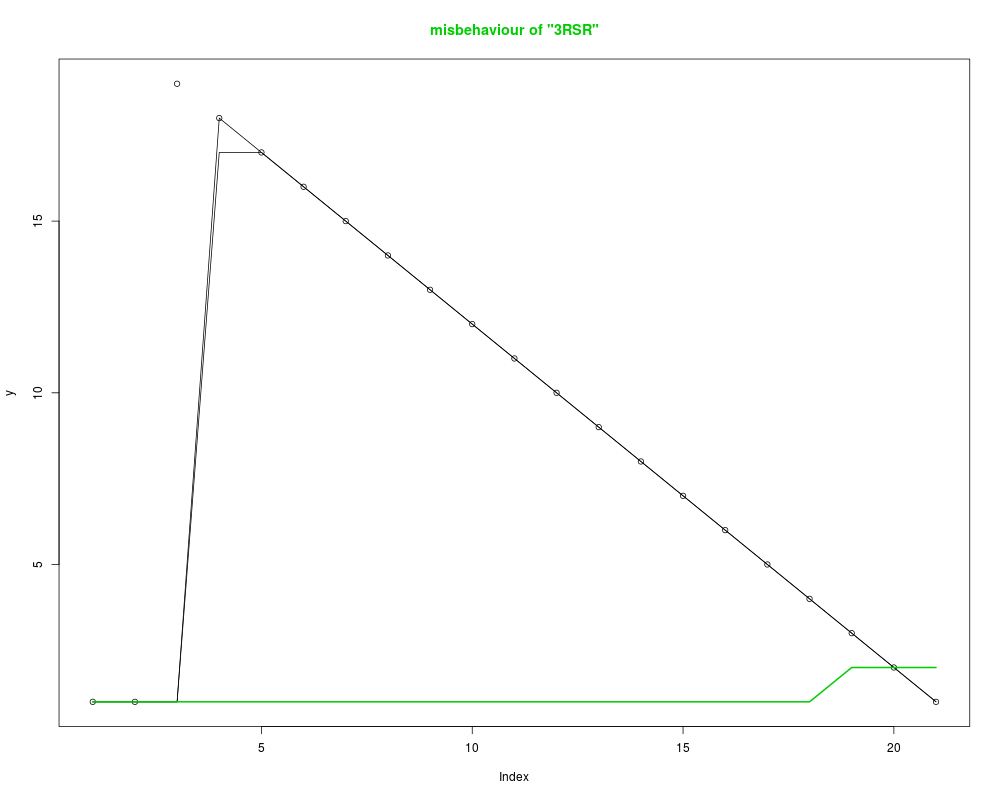
smooth> y <- c(1, 1, 19:1)
smooth> plot(y, main = "misbehaviour of "3RSR"", col.main = 3)
smooth> lines(sm.3RS(y))
smooth> lines(smooth(y))
smooth> lines(smooth(y, "3RSR"), col = 3, lwd = 2) # the horror
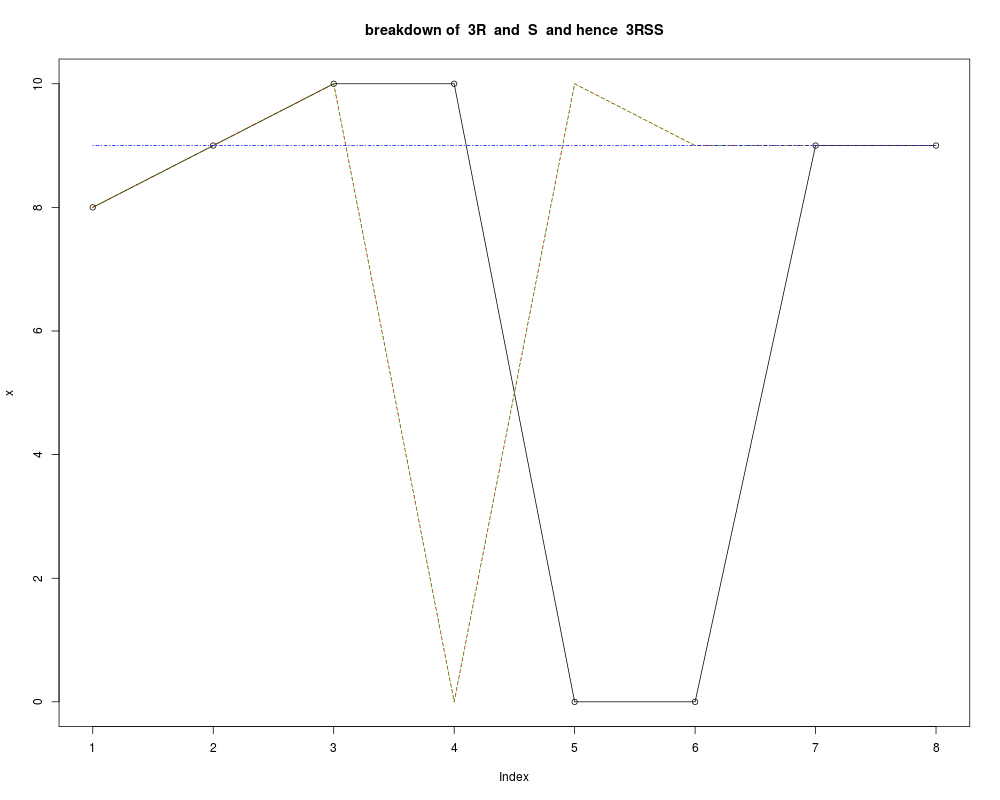
smooth> x <- c(8:10, 10, 0, 0, 9, 9)
smooth> plot(x, main = "breakdown of 3R and S and hence 3RSS")
smooth> matlines(cbind(smooth(x, "3R"), smooth(x, "S"), smooth(x, "3RSS"), smooth(x)))
smooth> presidents[is.na(presidents)] <- 0 # silly
smooth> summary(sm3 <- smooth(presidents, "3R"))
3R Tukey smoother resulting from
smooth(x = presidents, kind = "3R") ; n = 120
used 4 iterations
Min. 1st Qu. Median Mean 3rd Qu. Max.
0.0 44.0 57.0 54.2 71.0 82.0
smooth> summary(sm2 <- smooth(presidents,"3RSS"))
3RSS Tukey smoother resulting from
smooth(x = presidents, kind = "3RSS") ; n = 120
used 5 iterations
Min. 1st Qu. Median Mean 3rd Qu. Max.
0.00 44.00 57.00 55.45 69.00 82.00
smooth> summary(sm <- smooth(presidents))
3RS3R Tukey smoother resulting from
smooth(x = presidents) ; n = 120
used 7 iterations
Min. 1st Qu. Median Mean 3rd Qu. Max.
24.00 44.00 57.00 55.88 69.00 82.00
smooth> all.equal(c(sm2), c(smooth(smooth(sm3, "S"), "S"))) # 3RSS === 3R S S
[1] TRUE
smooth> all.equal(c(sm), c(smooth(smooth(sm3, "S"), "3R"))) # 3RS3R === 3R S 3R
[1] TRUE
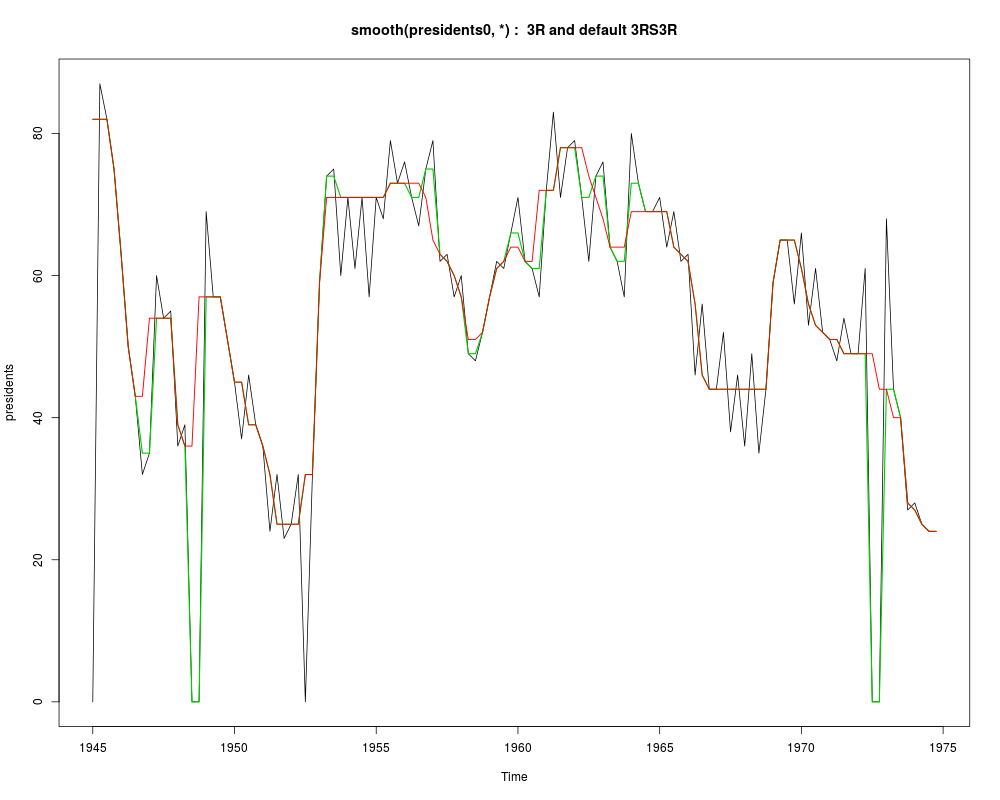
smooth> plot(presidents, main = "smooth(presidents0, *) : 3R and default 3RS3R")
smooth> lines(sm3, col = 3, lwd = 1.5)
smooth> lines(sm, col = 2, lwd = 1.25)
>
> ## set RNG *before* example as when R CMD check is run:
>
> r1 <- example(quantile, setRNG = TRUE)
quantl> quantile(x <- rnorm(1001)) # Extremes & Quartiles by default
0% 25% 50% 75% 100%
-3.00804860 -0.69731820 -0.03472603 0.68924373 3.81027668
quantl> quantile(x, probs = c(0.1, 0.5, 1, 2, 5, 10, 50, NA)/100)
0.1% 0.5% 1% 2% 5% 10%
-2.99694930 -2.59232767 -2.42431731 -2.24515257 -1.72663060 -1.33880074
50%
-0.03472603 NA
quantl> ### Compare different types
quantl> p <- c(0.1, 0.5, 1, 2, 5, 10, 50)/100
quantl> res <- matrix(as.numeric(NA), 9, 7)
quantl> for(type in 1:9) res[type, ] <- y <- quantile(x, p, type = type)
quantl> dimnames(res) <- list(1:9, names(y))
quantl> round(res, 3)
0.1% 0.5% 1% 2% 5% 10% 50%
1 -2.997 -2.592 -2.424 -2.245 -1.727 -1.339 -0.035
2 -2.997 -2.592 -2.424 -2.245 -1.727 -1.339 -0.035
3 -3.008 -2.596 -2.433 -2.265 -1.733 -1.344 -0.036
4 -3.008 -2.596 -2.433 -2.264 -1.733 -1.344 -0.035
5 -3.002 -2.594 -2.428 -2.255 -1.730 -1.341 -0.035
6 -3.008 -2.596 -2.432 -2.264 -1.733 -1.343 -0.035
7 -2.997 -2.592 -2.424 -2.245 -1.727 -1.339 -0.035
8 -3.004 -2.595 -2.430 -2.258 -1.731 -1.342 -0.035
9 -3.004 -2.595 -2.429 -2.257 -1.730 -1.341 -0.035
> x1 <- rnorm(1)
> u <- runif(1)
> ## identical random numbers
> r2 <- example(quantile, setRNG = TRUE)
quantl> quantile(x <- rnorm(1001)) # Extremes & Quartiles by default
0% 25% 50% 75% 100%
-3.00804860 -0.69731820 -0.03472603 0.68924373 3.81027668
quantl> quantile(x, probs = c(0.1, 0.5, 1, 2, 5, 10, 50, NA)/100)
0.1% 0.5% 1% 2% 5% 10%
-2.99694930 -2.59232767 -2.42431731 -2.24515257 -1.72663060 -1.33880074
50%
-0.03472603 NA
quantl> ### Compare different types
quantl> p <- c(0.1, 0.5, 1, 2, 5, 10, 50)/100
quantl> res <- matrix(as.numeric(NA), 9, 7)
quantl> for(type in 1:9) res[type, ] <- y <- quantile(x, p, type = type)
quantl> dimnames(res) <- list(1:9, names(y))
quantl> round(res, 3)
0.1% 0.5% 1% 2% 5% 10% 50%
1 -2.997 -2.592 -2.424 -2.245 -1.727 -1.339 -0.035
2 -2.997 -2.592 -2.424 -2.245 -1.727 -1.339 -0.035
3 -3.008 -2.596 -2.433 -2.265 -1.733 -1.344 -0.036
4 -3.008 -2.596 -2.433 -2.264 -1.733 -1.344 -0.035
5 -3.002 -2.594 -2.428 -2.255 -1.730 -1.341 -0.035
6 -3.008 -2.596 -2.432 -2.264 -1.733 -1.343 -0.035
7 -2.997 -2.592 -2.424 -2.245 -1.727 -1.339 -0.035
8 -3.004 -2.595 -2.430 -2.258 -1.731 -1.342 -0.035
9 -3.004 -2.595 -2.429 -2.257 -1.730 -1.341 -0.035
> x2 <- rnorm(1)
> stopifnot(identical(r1, r2))
> ## but x1 and x2 differ since the RNG state from before example()
> ## differs and is restored!
> x1; x2
[1] -1.30006
[1] -0.6914321
>
> ## Exploring examples code:
> ## How large are the examples of "lm...()" functions?
> lmex <- sapply(apropos("^lm", mode = "function"),
+ example, character.only = TRUE, give.lines = TRUE)
> sapply(lmex, length)
lm lm.fit lm.influence lm.wfit
33 37 18 37
>
>
>
>
>
> dev.off()
null device
1
>
|