Supported by Dr. Osamu Ogasawara and  . . |
|
Last data update: 2014.03.03 |
Fit a non-parametric mixture model from all identified substitutionsDescriptionEstimates the two-component mixture model consisting of the mixing coefficients and the density functions. UsagefitMixtureModel(countTable, substitution = "TC") Arguments
ValueA list containing:
Author(s)Federico Comoglio and Cem Sievers See Also
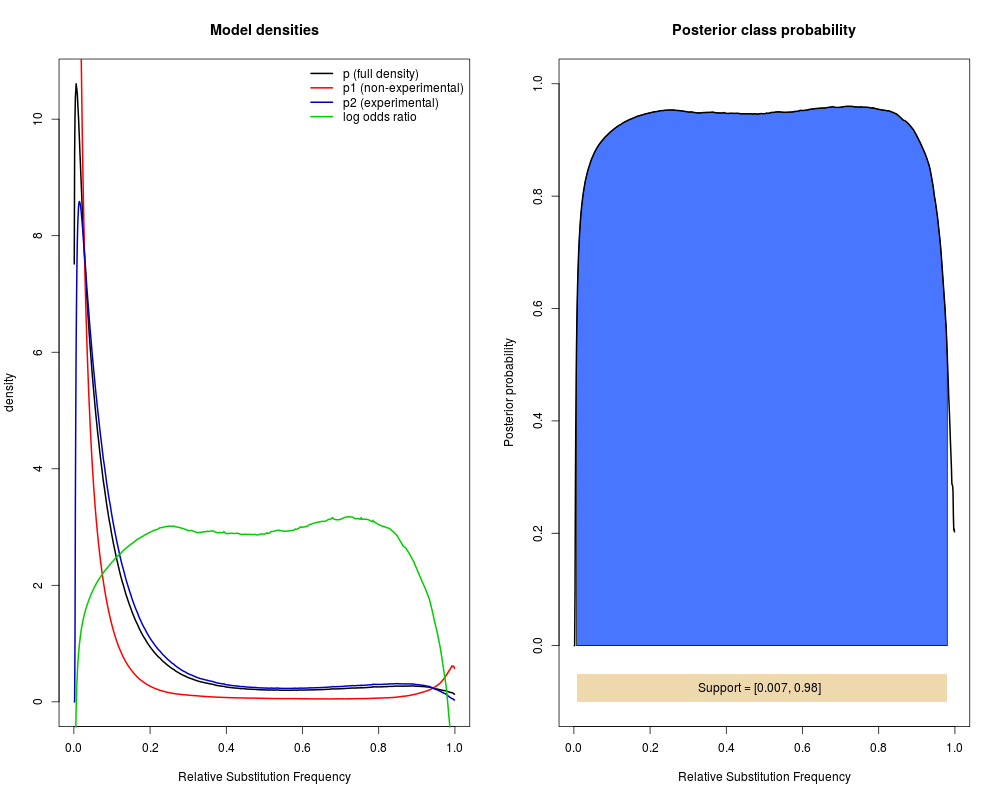
Examples## Not run: filename <- system.file( "extdata", "example.bam", package = "wavClusteR" ) example <- readSortedBam(filename = filename) countTable <- getAllSub( example, minCov = 10, cores = 1 ) fitMixtureModel( countTable, substitution = "TC" ) ## End(Not run) #load and inspect the model data( model ) str( model ) #plot densities and estimate the relative substitution frequency support dominated by PAR-CLIP induction getExpInterval( model, bayes = TRUE, plot = TRUE ) Results
R version 3.3.1 (2016-06-21) -- "Bug in Your Hair"
Copyright (C) 2016 The R Foundation for Statistical Computing
Platform: x86_64-pc-linux-gnu (64-bit)

R is free software and comes with ABSOLUTELY NO WARRANTY.
You are welcome to redistribute it under certain conditions.
Type 'license()' or 'licence()' for distribution details.

R is a collaborative project with many contributors.
Type 'contributors()' for more information and
'citation()' on how to cite R or R packages in publications.

Type 'demo()' for some demos, 'help()' for on-line help, or
'help.start()' for an HTML browser interface to help.
Type 'q()' to quit R.

> library(wavClusteR)
Loading required package: GenomicRanges
Loading required package: BiocGenerics
Loading required package: parallel

Attaching package: 'BiocGenerics'

The following objects are masked from 'package:parallel':

    clusterApply, clusterApplyLB, clusterCall, clusterEvalQ,
    clusterExport, clusterMap, parApply, parCapply, parLapply,
    parLapplyLB, parRapply, parSapply, parSapplyLB

The following objects are masked from 'package:stats':

    IQR, mad, xtabs

The following objects are masked from 'package:base':

    Filter, Find, Map, Position, Reduce, anyDuplicated, append,
    as.data.frame, cbind, colnames, do.call, duplicated, eval, evalq,
    get, grep, grepl, intersect, is.unsorted, lapply, lengths, mapply,
    match, mget, order, paste, pmax, pmax.int, pmin, pmin.int, rank,
    rbind, rownames, sapply, setdiff, sort, table, tapply, union,
    unique, unsplit

Loading required package: S4Vectors
Loading required package: stats4

Attaching package: 'S4Vectors'

The following objects are masked from 'package:base':

    colMeans, colSums, expand.grid, rowMeans, rowSums

Loading required package: IRanges
Loading required package: GenomeInfoDb
Loading required package: Rsamtools
Loading required package: Biostrings
Loading required package: XVector
> png(filename="/home/ddbj/snapshot/RGM3/R_BC/result/wavClusteR/FitMixtureModel.Rd_%03d_medium.png", width=480, height=480)
> ### Name: fitMixtureModel
> ### Title: Fit a non-parametric mixture model from all identified
> ###   substitutions
> ### Aliases: fitMixtureModel
> ### Keywords: core model
>
> ### ** Examples
>
>
> ## Not run:
> ##D filename <- system.file( "extdata", "example.bam", package = "wavClusteR" )
> ##D example <- readSortedBam(filename = filename)
> ##D countTable <- getAllSub( example, minCov = 10, cores = 1 )
> ##D
> ##D fitMixtureModel( countTable, substitution = "TC" )
> ## End(Not run)
>
> #load and inspect the model
> data( model )
> str( model )
List of 5
 $ l1: Named num 0.181
  ..- attr(*, "names")= chr "TC"
 $ l2: Named num 0.819
  ..- attr(*, "names")= chr "TC"
 $ p : num [1:999] 7.52 9.44 10.05 10.38 10.48 ...
 $ p1: num [1:999] 89.6 64.4 50.4 41.5 35.3 ...
 $ p2: num [1:999] 0 0 1.14 3.51 5 ...
>
> #plot densities and estimate the relative substitution frequency support dominated by PAR-CLIP induction
> getExpInterval( model, bayes = TRUE, plot = TRUE )
$supportStart
[1] 0.007

$supportEnd
[1] 0.98

>
>
>
>
>
>
> dev.off()
null device
          1
>
|
Created & Maintained by Osamu Ogasawara (osamu.ogasawara@gmail.com) and 