Supported by Dr. Osamu Ogasawara and  . . |
|
Last data update: 2014.03.03 |
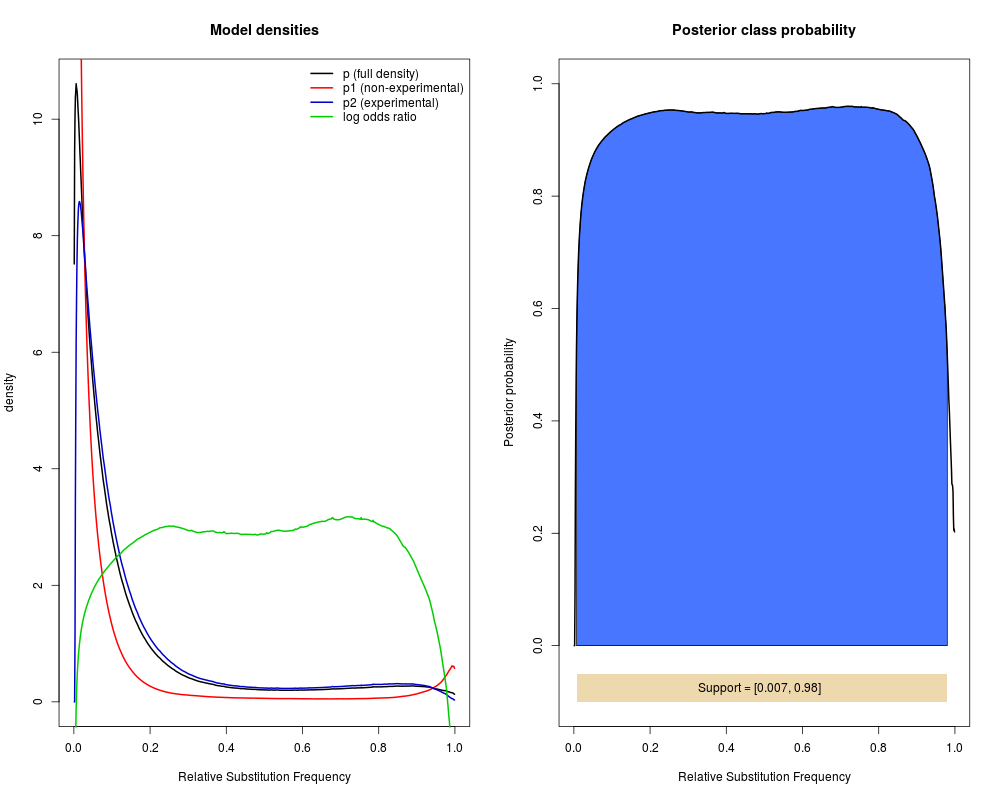
Identify the interval of relative substitution frequencies dominated by experimental induction.DescriptionIdentifies the interval/support of relative substitution frequencies (RSFs) dominated by the second model component, i.e. by the probability of being induced by the experimental procedure. In addition, this function can be used to generate diagnostic plots of the model fit, representing (i) model densities and log odds ratio (ii) the posterior class probability, i.e. the probability of a given observation being generated by experimental induction. UsagegetExpInterval(model, bayes = TRUE, leftProb, rightProb, plot = TRUE) Arguments
ValueA list with two numeric slots, corresponding to the extremes of the RSF interval (RSF support).
Author(s)Federico Comoglio and Cem Sievers ReferencesSievers C, Schlumpf T, Sawarkar R, Comoglio F and Paro R. (2012) Mixture models and wavelet transforms reveal high confidence RNA-protein interaction sites in MOV10 PAR-CLIP data, Nucleic Acids Res. 40(20):e160. doi: 10.1093/nar/gks697 Comoglio F, Sievers C and Paro R (2015) Sensitive and highly resolved identification of RNA-protein interaction sites in PAR-CLIP data, BMC Bioinformatics 16, 32. See Also
Examplesdata( model ) #default support <- getExpInterval( model = model, bayes = TRUE, plot = TRUE ) support #custom interval (based, e.g. on visual inspection of posterior class probability # or evaluation of FDR using the estimateFDRF function) support <- getExpInterval( model = model, leftProb = 0.2, rightProb = 0.7, plot = TRUE ) support Results
R version 3.3.1 (2016-06-21) -- "Bug in Your Hair"
Copyright (C) 2016 The R Foundation for Statistical Computing
Platform: x86_64-pc-linux-gnu (64-bit)

R is free software and comes with ABSOLUTELY NO WARRANTY.
You are welcome to redistribute it under certain conditions.
Type 'license()' or 'licence()' for distribution details.

R is a collaborative project with many contributors.
Type 'contributors()' for more information and
'citation()' on how to cite R or R packages in publications.

Type 'demo()' for some demos, 'help()' for on-line help, or
'help.start()' for an HTML browser interface to help.
Type 'q()' to quit R.

> library(wavClusteR)
Loading required package: GenomicRanges
Loading required package: BiocGenerics
Loading required package: parallel

Attaching package: 'BiocGenerics'

The following objects are masked from 'package:parallel':

    clusterApply, clusterApplyLB, clusterCall, clusterEvalQ,
    clusterExport, clusterMap, parApply, parCapply, parLapply,
    parLapplyLB, parRapply, parSapply, parSapplyLB

The following objects are masked from 'package:stats':

    IQR, mad, xtabs

The following objects are masked from 'package:base':

    Filter, Find, Map, Position, Reduce, anyDuplicated, append,
    as.data.frame, cbind, colnames, do.call, duplicated, eval, evalq,
    get, grep, grepl, intersect, is.unsorted, lapply, lengths, mapply,
    match, mget, order, paste, pmax, pmax.int, pmin, pmin.int, rank,
    rbind, rownames, sapply, setdiff, sort, table, tapply, union,
    unique, unsplit

Loading required package: S4Vectors
Loading required package: stats4

Attaching package: 'S4Vectors'

The following objects are masked from 'package:base':

    colMeans, colSums, expand.grid, rowMeans, rowSums

Loading required package: IRanges
Loading required package: GenomeInfoDb
Loading required package: Rsamtools
Loading required package: Biostrings
Loading required package: XVector
> png(filename="/home/ddbj/snapshot/RGM3/R_BC/result/wavClusteR/getExpInterval.Rd_%03d_medium.png", width=480, height=480)
> ### Name: getExpInterval
> ### Title: Identify the interval of relative substitution frequencies
> ###   dominated by experimental induction.
> ### Aliases: getExpInterval
> ### Keywords: core graphics
>
> ### ** Examples
>
>
> data( model )
>
> #default
> support <- getExpInterval( model = model, bayes = TRUE, plot = TRUE )
> support
$supportStart
[1] 0.007

$supportEnd
[1] 0.98

>
> #custom interval (based, e.g. on visual inspection of posterior class probability
> # or evaluation of FDR using the estimateFDRF function)
> support <- getExpInterval( model = model, leftProb = 0.2, rightProb = 0.7, plot = TRUE )
> support
$supportStart
[1] 0.007

$supportEnd
[1] 0.98

>
>
>
>
>
>
> dev.off()
null device
          1
>
|