Supported by Dr. Osamu Ogasawara and  . . |
|
Last data update: 2014.03.03 |
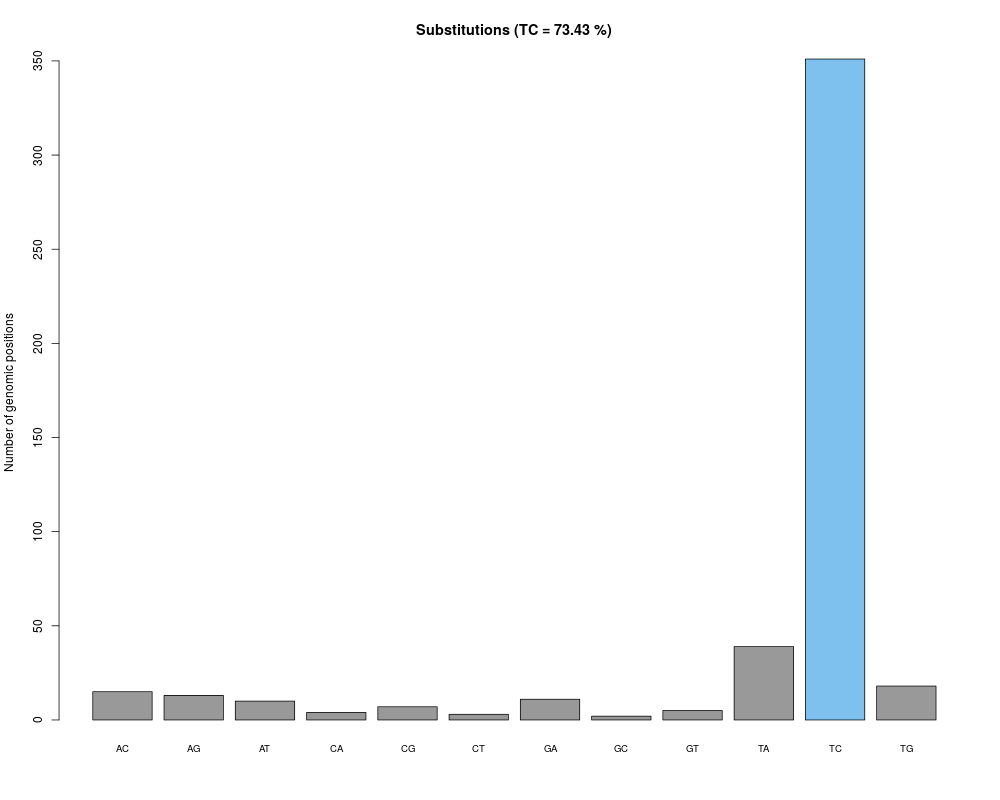
Barplot visualization of the number of genomic positions exhibiting a given substitution and, if model provided, additional diagnostic plots.DescriptionGraphical representation of the total number of genomic positions exhibiting one or more substitutions of a given type. This information is used to estimate the mixing coefficients of the non-parametric mixture model. If the mixture model fit is provided, returns additional diagnostic plots such as the total number of reads exhibiting a given substitution and relative substitution frequency-dependent representations of the total number of genomic positions with substitutions of a given type. UsageplotSubstitutions(countTable, highlight = "TC", model) Arguments
Valuecalled for its effect Author(s)Federico Comoglio and Cem Sievers See Also
Examplesfilename <- system.file( "extdata", "example.bam", package = "wavClusteR" ) example <- readSortedBam( filename = filename ) countTable <- getAllSub( example, minCov = 10, cores = 1 ) plotSubstitutions(countTable = countTable, highlight = "TC") Results
R version 3.3.1 (2016-06-21) -- "Bug in Your Hair"
Copyright (C) 2016 The R Foundation for Statistical Computing
Platform: x86_64-pc-linux-gnu (64-bit)

R is free software and comes with ABSOLUTELY NO WARRANTY.
You are welcome to redistribute it under certain conditions.
Type 'license()' or 'licence()' for distribution details.

R is a collaborative project with many contributors.
Type 'contributors()' for more information and
'citation()' on how to cite R or R packages in publications.

Type 'demo()' for some demos, 'help()' for on-line help, or
'help.start()' for an HTML browser interface to help.
Type 'q()' to quit R.

> library(wavClusteR)
Loading required package: GenomicRanges
Loading required package: BiocGenerics
Loading required package: parallel

Attaching package: 'BiocGenerics'

The following objects are masked from 'package:parallel':

    clusterApply, clusterApplyLB, clusterCall, clusterEvalQ,
    clusterExport, clusterMap, parApply, parCapply, parLapply,
    parLapplyLB, parRapply, parSapply, parSapplyLB

The following objects are masked from 'package:stats':

    IQR, mad, xtabs

The following objects are masked from 'package:base':

    Filter, Find, Map, Position, Reduce, anyDuplicated, append,
    as.data.frame, cbind, colnames, do.call, duplicated, eval, evalq,
    get, grep, grepl, intersect, is.unsorted, lapply, lengths, mapply,
    match, mget, order, paste, pmax, pmax.int, pmin, pmin.int, rank,
    rbind, rownames, sapply, setdiff, sort, table, tapply, union,
    unique, unsplit

Loading required package: S4Vectors
Loading required package: stats4

Attaching package: 'S4Vectors'

The following objects are masked from 'package:base':

    colMeans, colSums, expand.grid, rowMeans, rowSums

Loading required package: IRanges
Loading required package: GenomeInfoDb
Loading required package: Rsamtools
Loading required package: Biostrings
Loading required package: XVector
> png(filename="/home/ddbj/snapshot/RGM3/R_BC/result/wavClusteR/plotSubstitutions.Rd_%03d_medium.png", width=480, height=480)
> ### Name: plotSubstitutions
> ### Title: Barplot visualization of the number of genomic positions
> ###   exhibiting a given substitution and, if model provided, additional
> ###   diagnostic plots.
> ### Aliases: plotSubstitutions
> ### Keywords: graphics
>
> ### ** Examples
>
>
> filename <- system.file( "extdata", "example.bam", package = "wavClusteR" )
> example <- readSortedBam( filename = filename )
> countTable <- getAllSub( example, minCov = 10, cores = 1 )
Loading required package: doMC
Loading required package: foreach
Loading required package: iterators
Considering substitutions, n = 497, processing in 1 chunks
   chunk #: 1
   considering the + strand
Computing local coverage at substitutions...
   considering the - strand
Computing local coverage at substitutions...
> plotSubstitutions(countTable = countTable, highlight = "TC")
>
>
>
>
>
>
> dev.off()
null device
          1
>
|