Supported by Dr. Osamu Ogasawara and  . . |
|
Last data update: 2014.03.03 |
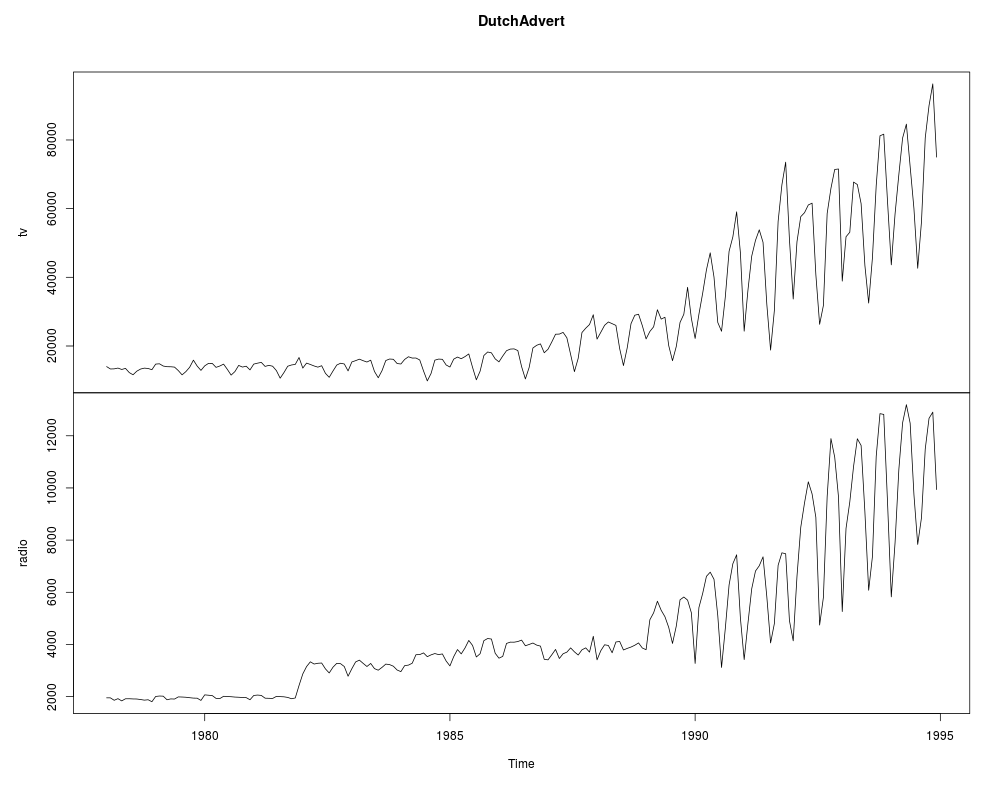
TV and Radio Advertising Expenditures DataDescriptionTime series of television and radio advertising expenditures (in real terms) in The Netherlands. Usagedata("DutchAdvert")
FormatA four-weekly multiple time series from 1978(1) to 1994(13) with 2 variables.
SourceOnline complements to Franses (1998). http://www.few.eur.nl/few/people/franses/research/book2.htm ReferencesFranses, P.H. (1998). Time Series Models for Business and Economic Forecasting. Cambridge, UK: Cambridge University Press. See Also
Examples
data("DutchAdvert")
plot(DutchAdvert)

## EACF tables (Franses 1998, p. 99)
ctrafo <- function(x) residuals(lm(x ~ factor(cycle(x))))
ddiff <- function(x) diff(diff(x, frequency(x)), 1)
eacf <- function(y, lag = 12) {
  stopifnot(all(lag > 0))
  if(length(lag) < 2) lag <- 1:lag
  rval <- sapply(
    list(y = y, dy = diff(y), cdy = ctrafo(diff(y)),
         Dy = diff(y, frequency(y)), dDy = ddiff(y)),
    function(x) acf(x, plot = FALSE, lag.max = max(lag))$acf[lag + 1])
  rownames(rval) <- lag
  return(rval)
}

## Franses (1998), Table 5.4
round(eacf(log(DutchAdvert[,"tv"]), lag = c(1:19, 26, 39)), digits = 3)
Results
R version 3.3.1 (2016-06-21) -- "Bug in Your Hair"
Copyright (C) 2016 The R Foundation for Statistical Computing
Platform: x86_64-pc-linux-gnu (64-bit)

R is free software and comes with ABSOLUTELY NO WARRANTY.
You are welcome to redistribute it under certain conditions.
Type 'license()' or 'licence()' for distribution details.

R is a collaborative project with many contributors.
Type 'contributors()' for more information and
'citation()' on how to cite R or R packages in publications.

Type 'demo()' for some demos, 'help()' for on-line help, or
'help.start()' for an HTML browser interface to help.
Type 'q()' to quit R.

> library(AER)
Loading required package: car
Loading required package: lmtest
Loading required package: zoo

Attaching package: 'zoo'

The following objects are masked from 'package:base':

    as.Date, as.Date.numeric

Loading required package: sandwich
Loading required package: survival
> png(filename="/home/ddbj/snapshot/RGM3/R_CC/result/AER/DutchAdvert.Rd_%03d_medium.png", width=480, height=480)
> ### Name: DutchAdvert
> ### Title: TV and Radio Advertising Expenditures Data
> ### Aliases: DutchAdvert
> ### Keywords: datasets
>
> ### ** Examples
>
> data("DutchAdvert")
> plot(DutchAdvert)
>
> ## EACF tables (Franses 1998, p. 99)
> ctrafo <- function(x) residuals(lm(x ~ factor(cycle(x))))
> ddiff <- function(x) diff(diff(x, frequency(x)), 1)
> eacf <- function(y, lag = 12) {
+   stopifnot(all(lag > 0))
+   if(length(lag) < 2) lag <- 1:lag
+   rval <- sapply(
+     list(y = y, dy = diff(y), cdy = ctrafo(diff(y)),
+          Dy = diff(y, frequency(y)), dDy = ddiff(y)),
+     function(x) acf(x, plot = FALSE, lag.max = max(lag))$acf[lag + 1])
+   rownames(rval) <- lag
+   return(rval)
+ }
>
> ## Franses (1998), Table 5.4
> round(eacf(log(DutchAdvert[,"tv"]), lag = c(1:19, 26, 39)), digits = 3)
       y     dy    cdy    Dy    dDy
1  0.933  0.215  0.039 0.663 -0.301
2  0.836 -0.352 -0.255 0.529 -0.111
3  0.781 -0.418 -0.316 0.471 -0.083
4  0.774 -0.351 -0.301 0.466  0.044
5  0.813 -0.013 -0.020 0.431  0.001
6  0.857  0.417  0.346 0.393 -0.003
7  0.848  0.438  0.409 0.357  0.036
8  0.786 -0.008  0.024 0.299  0.008
9  0.723 -0.348 -0.308 0.233 -0.031
10 0.700 -0.398 -0.288 0.191 -0.022
11 0.725 -0.324 -0.191 0.162  0.026
12 0.788  0.240  0.109 0.119  0.105
13 0.829  0.810  0.531 0.004 -0.412
14 0.773  0.265  0.183 0.172  0.312
15 0.683 -0.331 -0.210 0.125 -0.103
16 0.630 -0.370 -0.222 0.146  0.096
17 0.621 -0.334 -0.277 0.103  0.008
18 0.656 -0.025 -0.053 0.050 -0.187
19 0.699  0.383  0.274 0.127  0.003
26 0.672  0.728  0.399 0.111 -0.002
39 0.500  0.650  0.294 0.172  0.034
>
>
>
>
>
> dev.off()
null device
          1
>
|
Created & Maintained by Osamu Ogasawara (osamu.ogasawara@gmail.com) and 