Supported by Dr. Osamu Ogasawara and  . . |
|
Last data update: 2014.03.03 |
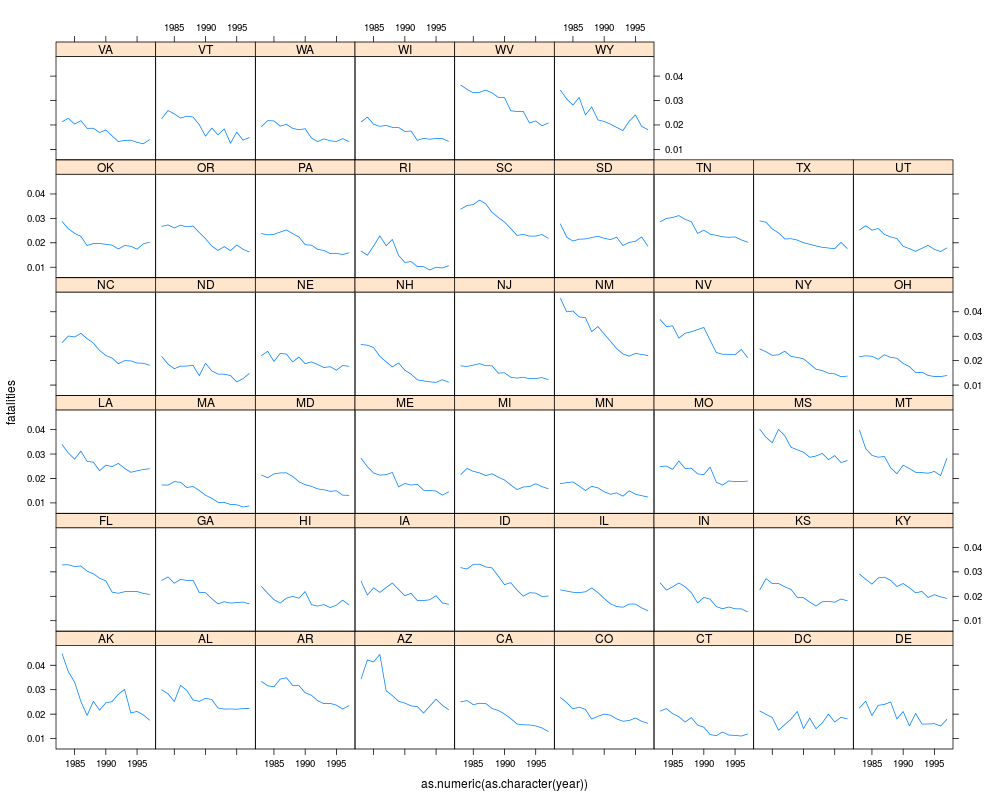
Effects of Mandatory Seat Belt Laws in the USDescriptionBalanced panel data for the years 1983–1997 from 50 US States, plus the District of Columbia, for assessing traffic fatalities and seat belt usage. Usagedata("USSeatBelts")
FormatA data frame containing 765 observations on 12 variables.
DetailsSome data series from Cohen and Einav (2003) have not been included in the data frame. SourceOnline complements to Stock and Watson (2007). http://wps.aw.com/aw_stock_ie_2/ ReferencesCohen, A., and Einav, L. (2003). The Effects of Mandatory Seat Belt Laws on Driving Behavior and Traffic Fatalities. The Review of Economics and Statistics, 85, 828–843 Stock, J.H. and Watson, M.W. (2007). Introduction to Econometrics, 2nd ed. Boston: Addison Wesley. See Also
Examples
data("USSeatBelts")
summary(USSeatBelts)

library("lattice")
xyplot(fatalities ~ as.numeric(as.character(year)) | state, data = USSeatBelts, type = "l")
Results
R version 3.3.1 (2016-06-21) -- "Bug in Your Hair"
Copyright (C) 2016 The R Foundation for Statistical Computing
Platform: x86_64-pc-linux-gnu (64-bit)

R is free software and comes with ABSOLUTELY NO WARRANTY.
You are welcome to redistribute it under certain conditions.
Type 'license()' or 'licence()' for distribution details.

R is a collaborative project with many contributors.
Type 'contributors()' for more information and
'citation()' on how to cite R or R packages in publications.

Type 'demo()' for some demos, 'help()' for on-line help, or
'help.start()' for an HTML browser interface to help.
Type 'q()' to quit R.

> library(AER)
Loading required package: car
Loading required package: lmtest
Loading required package: zoo

Attaching package: 'zoo'

The following objects are masked from 'package:base':

    as.Date, as.Date.numeric

Loading required package: sandwich
Loading required package: survival
> png(filename="/home/ddbj/snapshot/RGM3/R_CC/result/AER/USSeatBelts.Rd_%03d_medium.png", width=480, height=480)
> ### Name: USSeatBelts
> ### Title: Effects of Mandatory Seat Belt Laws in the US
> ### Aliases: USSeatBelts
> ### Keywords: datasets
>
> ### ** Examples
>
> data("USSeatBelts")
> summary(USSeatBelts)
     state          year         miles          fatalities
 AK     : 15   1983   : 51   Min.   :  3099   Min.   :0.008327
 AL     : 15   1984   : 51   1st Qu.: 11401   1st Qu.:0.017341
 AR     : 15   1985   : 51   Median : 30319   Median :0.021199
 AZ     : 15   1986   : 51   Mean   : 41448   Mean   :0.021490
 CA     : 15   1987   : 51   3rd Qu.: 52312   3rd Qu.:0.024774
 CO     : 15   1988   : 51   Max.   :285612   Max.   :0.045470
 (Other):675   (Other):459
    seatbelt      speed65   speed70   drinkage  alcohol       income
 Min.   :0.0600   no :271   no :711   no : 88   no :676   Min.   : 8372
 1st Qu.:0.4200   yes:494   yes: 54   yes:677   yes: 89   1st Qu.:14266
 Median :0.5500                                           Median :17624
 Mean   :0.5289                                           Mean   :17993
 3rd Qu.:0.6500                                           3rd Qu.:21080
 Max.   :0.8700                                           Max.   :35863
 NA's   :209
      age             enforce
 Min.   :28.23   no       :293
 1st Qu.:34.39   primary  : 93
 Median :35.39   secondary:379
 Mean   :35.14
 3rd Qu.:36.13
 Max.   :39.17

>
> library("lattice")
> xyplot(fatalities ~ as.numeric(as.character(year)) | state, data = USSeatBelts, type = "l")
>
>
>
>
>
> dev.off()
null device
          1
>
|