Supported by Dr. Osamu Ogasawara and  . . |
|
Last data update: 2014.03.03 |
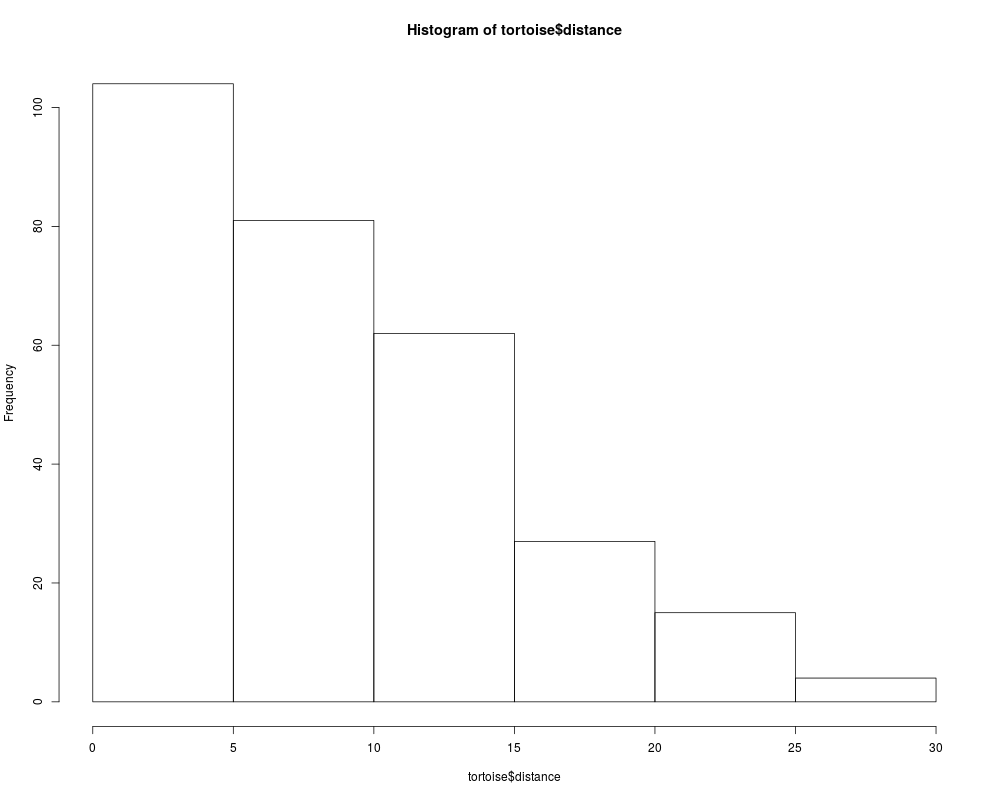
Gopher Tortoise Distance Sampling DataDescriptionThis simulated data set by Mazerolle (2015) is based on the biological parameters for the Gopher Tortoise (Gopherus polyphemus) reported by Smith et al. (2009). A half-normal distribution with a scale of 10 and without an adjustment factor was used to simulate the distance data for a study area of 120 km^2. An effort of 500 m in 300 line transects was deployed. A density of 72 individuals per km^2 was used in the simulation using the approach outlined in Buckland et al. (2001). Usagedata(tortoise) FormatA data frame with 410 observations on the following 5 variables.
DetailsThis data set is used to illustrate classic distance sampling (Buckland et al. 2001, Mazerolle 2015). SourceBuckland, S. T., Anderson, D. R., Burnham, K. P., Laake, J. L., Borchers, D. L., Thomas, L. (2001) Introduction to distance sampling: estimating abundance of biological populations. Oxford University Press: Oxford. Mazerolle, M. J. (2015) Estimating detectability and biological parameters of interest with the use of the R environment. Journal of Herpetology 49, 541–559. Smith, L. L., Linehan, J. M., Stober, J. M., Elliott, M. J., Jensen, J. B. (2009) An evaluation of distance sampling for large-scale gopher tortoise surveys in Georgia, USA. Applied Herpetology 6, 355–368. Examplesdata(tortoise) str(tortoise) ##plot distance data to determine if truncation is required ##(Buckland et al. 2001, pp. 15--17) hist(tortoise$distance) Results
R version 3.3.1 (2016-06-21) -- "Bug in Your Hair"
Copyright (C) 2016 The R Foundation for Statistical Computing
Platform: x86_64-pc-linux-gnu (64-bit)

R is free software and comes with ABSOLUTELY NO WARRANTY.
You are welcome to redistribute it under certain conditions.
Type 'license()' or 'licence()' for distribution details.

R is a collaborative project with many contributors.
Type 'contributors()' for more information and
'citation()' on how to cite R or R packages in publications.

Type 'demo()' for some demos, 'help()' for on-line help, or
'help.start()' for an HTML browser interface to help.
Type 'q()' to quit R.

> library(AICcmodavg)
> png(filename="/home/ddbj/snapshot/RGM3/R_CC/result/AICcmodavg/tortoise.Rd_%03d_medium.png", width=480, height=480)
> ### Name: tortoise
> ### Title: Gopher Tortoise Distance Sampling Data
> ### Aliases: tortoise
> ### Keywords: datasets
>
> ### ** Examples
>
> data(tortoise)
> str(tortoise)
'data.frame':	410 obs. of  5 variables:
 $ Region.Label: int  1 1 1 1 1 1 1 1 1 1 ...
 $ Area        : num  1.2e+08 1.2e+08 1.2e+08 1.2e+08 1.2e+08 1.2e+08 1.2e+08 1.2e+08 1.2e+08 1.2e+08 ...
 $ Sample.Label: int  1 1 2 3 4 5 5 5 6 6 ...
 $ Effort      : int  500 500 500 500 500 500 500 500 500 500 ...
 $ distance    : num  5.1 9.4 1.2 NA 5.4 11.1 5.2 4.6 7.5 8.4 ...
>
> ##plot distance data to determine if truncation is required
> ##(Buckland et al. 2001, pp. 15--17)
> hist(tortoise$distance)
>
>
>
>
>
> dev.off()
null device
          1
>
|