Supported by Dr. Osamu Ogasawara and  . . |
|
Last data update: 2014.03.03 |
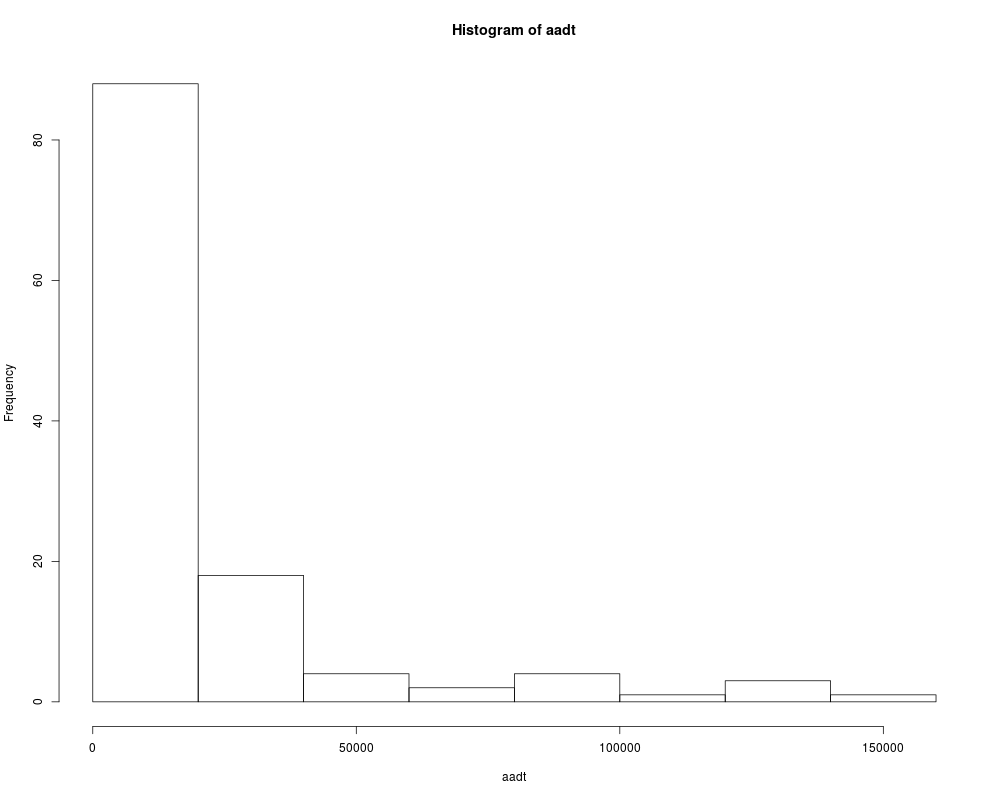
Average Annual Daily Traffic DataDescriptionAverage annual daily traffic data collected from the Minnesota Department of Transportation data base. Usagedata(AADT) FormatA data frame with 121 observations on the following 8 variables.
ReferencesCheng, C. (1992). Optimal Sampling for Traffic Volume Estimation, Unpublished Ph.D. dissertation, University of Minnesota, Carlson School of Management. Neter, J., Kutner, M.H., Nachtsheim, C.J.,Wasserman, W. (1996). Applied Linear Statistical Models (4th ed.), Irwin, page 483. Examplesdata(AADT) attach(AADT) hist(aadt) boxcoxfr(aadt, class) Results
R version 3.3.1 (2016-06-21) -- "Bug in Your Hair"
Copyright (C) 2016 The R Foundation for Statistical Computing
Platform: x86_64-pc-linux-gnu (64-bit)

R is free software and comes with ABSOLUTELY NO WARRANTY.
You are welcome to redistribute it under certain conditions.
Type 'license()' or 'licence()' for distribution details.

R is a collaborative project with many contributors.
Type 'contributors()' for more information and
'citation()' on how to cite R or R packages in publications.

Type 'demo()' for some demos, 'help()' for on-line help, or
'help.start()' for an HTML browser interface to help.
Type 'q()' to quit R.

> library(AID)
> png(filename="/home/ddbj/snapshot/RGM3/R_CC/result/AID/AADT.Rd_%03d_medium.png", width=480, height=480)
> ### Name: AADT
> ### Title: Average Annual Daily Traffic Data
> ### Aliases: AADT
> ### Keywords: datasets
>
> ### ** Examples
>
> data(AADT)
> attach(AADT)
> hist(aadt)
> boxcoxfr(aadt, class)
$method
[1] "MLEFR"

$date
[1] "Mon Jul  4 14:12:01 2016"

$lambda.hat
[1] 0.06

$shapiro.test
                W    p-value
Group 1 0.9612974 0.82236565
Group 2 0.9596730 0.05859466
Group 3 0.9257613 0.16348465
Group 4 0.9627784 0.22051373

$bartlett.test
 K-squared df   p-value
  4.822634  3 0.1852551

>
>
>
>
>
> dev.off()
null device
          1
>
|