Supported by Dr. Osamu Ogasawara and  . . |
|
Last data update: 2014.03.03 |
Data inspired by GC mass spectrometry experimentsDescriptionData inspired by GC mass spectrometry experiments. Usage
data("multiex")
Format
Examples
data("multiex")
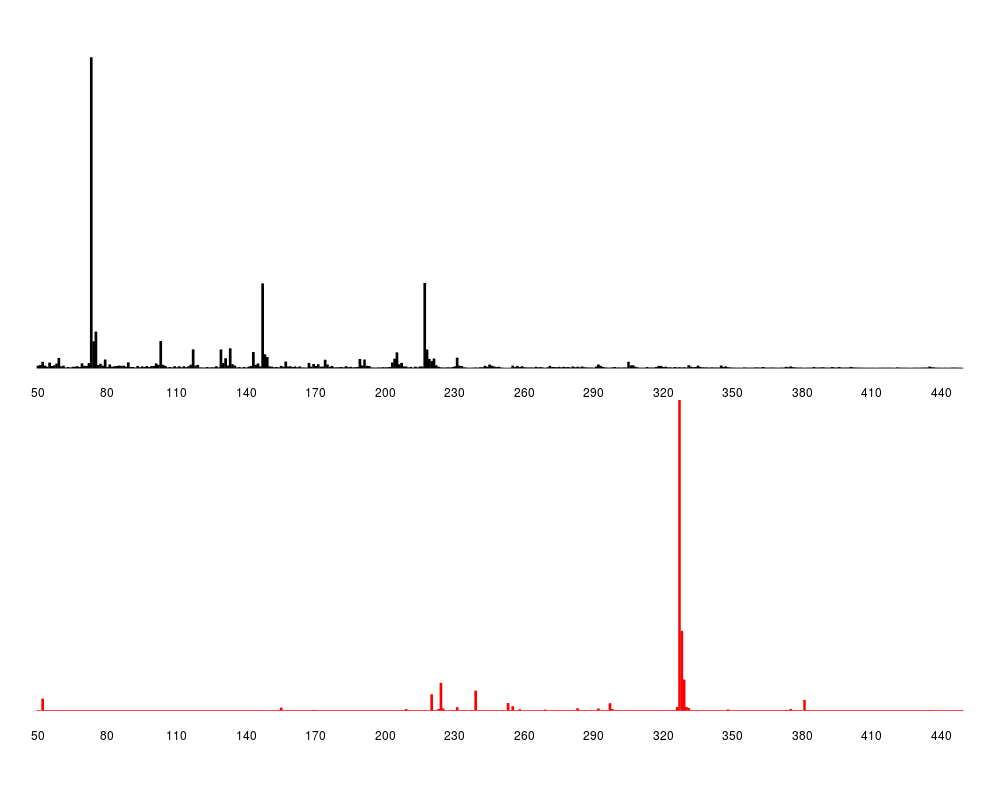
## mass spectra in the data
plotS(S,x2)
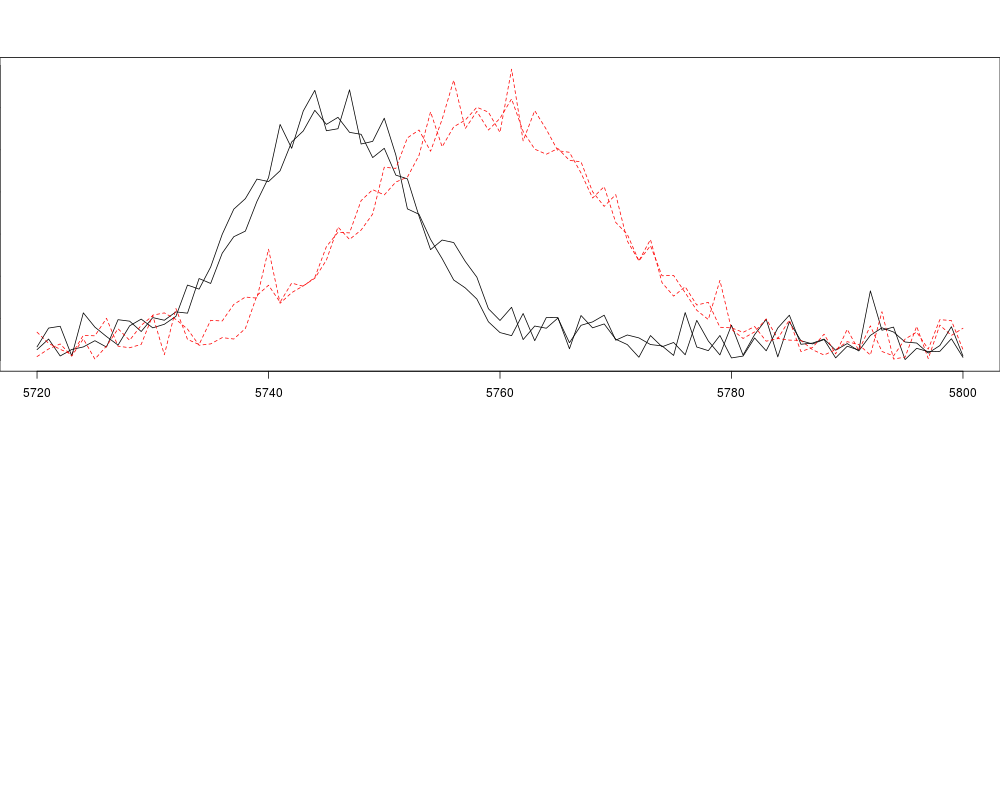
## starting values for elution profiles
matplot(x,Cstart1,type="l")
matplot(x,Cstart2,type="l",add=TRUE)
Results
R version 3.3.1 (2016-06-21) -- "Bug in Your Hair"
Copyright (C) 2016 The R Foundation for Statistical Computing
Platform: x86_64-pc-linux-gnu (64-bit)

R is free software and comes with ABSOLUTELY NO WARRANTY.
You are welcome to redistribute it under certain conditions.
Type 'license()' or 'licence()' for distribution details.

R is a collaborative project with many contributors.
Type 'contributors()' for more information and
'citation()' on how to cite R or R packages in publications.

Type 'demo()' for some demos, 'help()' for on-line help, or
'help.start()' for an HTML browser interface to help.
Type 'q()' to quit R.

> library(ALS)
Loading required package: nnls
Loading required package: Iso
Iso 0.0-17
> png(filename="/home/ddbj/snapshot/RGM3/R_CC/result/ALS/multiex.Rd_%03d_medium.png", width=480, height=480)
> ### Name: multiex
> ### Title: Data inspired by GC mass spectrometry experiments
> ### Aliases: multiex d1 d2 Cstart1 Cstart2 S x x2
> ### Keywords: datasets
>
> ### ** Examples
>
> data("multiex")
> ## mass spectra in the data
> plotS(S,x2)
>
> ## starting values for elution profiles
> matplot(x,Cstart1,type="l")
> matplot(x,Cstart2,type="l",add=TRUE)
>
>
>
>
>
> dev.off()
null device
          1
>
|
Created & Maintained by Osamu Ogasawara (osamu.ogasawara@gmail.com) and 