Supported by Dr. Osamu Ogasawara and  . . |
|
Last data update: 2014.03.03 |
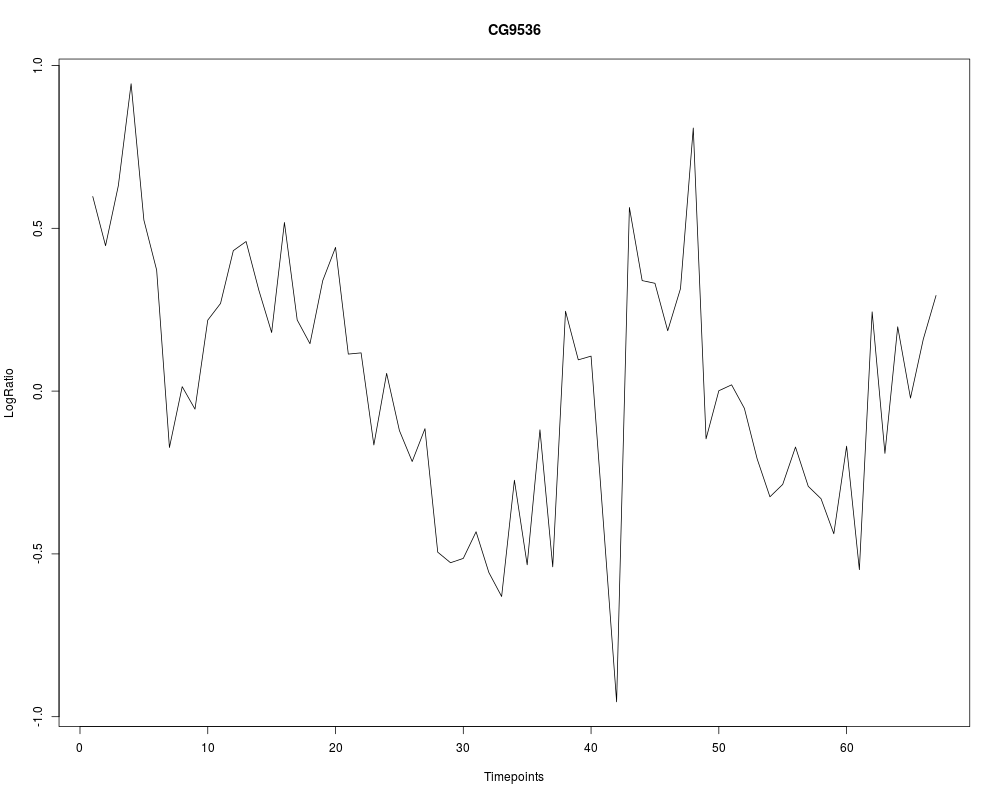
Drosphila life cycyle time series by Arbeitman et al 2002.DescriptionGene expression time series for 4028 genes involved in the life cycle of Drosophila melanogaster. The microarray data measured gene expression levels during all four major stages of morphogenesis: embryo, larva, pupa and adult (67 time points). Data published in Arbeitman et al. (2002) and used in Lebre et al. (2010) Usagedata(drosophila) FormatA matrix of 4028 row (genes) by 67 columns (timepoints) containing the gene expression time series. SourceThe data has been published in Arbeitman et al (2002). ReferencesGene expression during the life cycle of Drosophila melanogaster. M.N Arbeitman, E.E.M. Furlong, F. Imam, E. Johson, B.H. Null, B.S. Baker, M.A. Krasnow, M.P. Scott, R.W. Davis and K.P. White. Science, 297(5590):2270-2275, 2002. Statistical inference of the time-varying structure of gene-regulation networks S. Lebre, J. Becq, F. Devaux, M. P. H. Stumpf, G. Lelandais, BMC Systems Biology, 2010, 4:130. Examples#load the data data(drosophila) #plot time serie for a chosen gene gene=1 plot(1:67,drosophila[gene,],type="l",xlab="Timepoints", ylab="LogRatio", main=row.names(drosophila)[gene]) Results
R version 3.3.1 (2016-06-21) -- "Bug in Your Hair"
Copyright (C) 2016 The R Foundation for Statistical Computing
Platform: x86_64-pc-linux-gnu (64-bit)

R is free software and comes with ABSOLUTELY NO WARRANTY.
You are welcome to redistribute it under certain conditions.
Type 'license()' or 'licence()' for distribution details.

R is a collaborative project with many contributors.
Type 'contributors()' for more information and
'citation()' on how to cite R or R packages in publications.

Type 'demo()' for some demos, 'help()' for on-line help, or
'help.start()' for an HTML browser interface to help.
Type 'q()' to quit R.

> library(ARTIVA)
Loading required package: MASS
Loading required package: igraph

Attaching package: 'igraph'

The following objects are masked from 'package:stats':

    decompose, spectrum

The following object is masked from 'package:base':

    union

Loading required package: gplots

Attaching package: 'gplots'

The following object is masked from 'package:stats':

    lowess

> png(filename="/home/ddbj/snapshot/RGM3/R_CC/result/ARTIVA/drosophila.Rd_%03d_medium.png", width=480, height=480)
> ### Name: drosophila
> ### Title: Drosphila life cycyle time series by Arbeitman et al 2002.
> ### Aliases: drosophila
> ### Keywords: datasets
>
> ### ** Examples
>
> #load the data
> data(drosophila)
>
> #plot time serie for a chosen gene
> gene=1
> plot(1:67,drosophila[gene,],type="l",xlab="Timepoints", ylab="LogRatio",
+ main=row.names(drosophila)[gene])
>
>
>
>
>
> dev.off()
null device
          1
>
|