Supported by Dr. Osamu Ogasawara and  . . |
|
Last data update: 2014.03.03 |
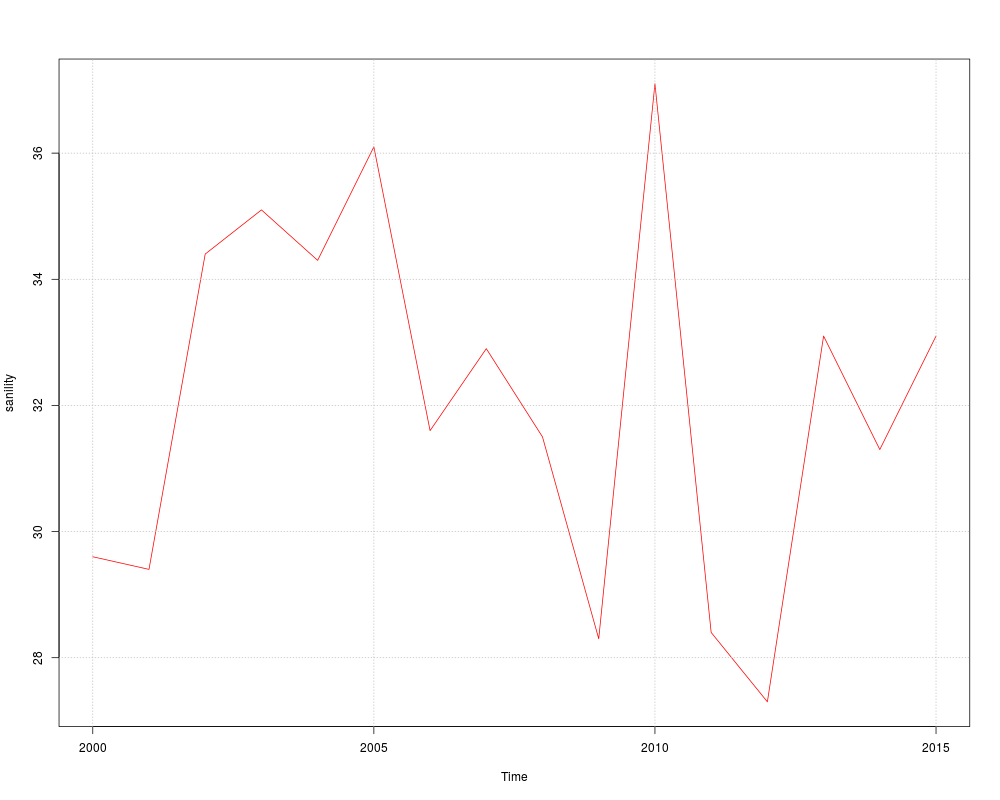
Time Series of Crest of Sanility in Ca Mau ProvinceDescriptionA time series of sanility from 2000 to 2015. Usagedata("sanility")
SourceVo Van Tai, Duong Ton Dam, Pham Minh Truc, Dang Kien Cuong, 2016. Forecasting crest of sanility at three main stations of Ca Mau province by fuzzy time series model. Examplesdata(sanility) ts.plot(sanility,col="red") grid.on() Results
R version 3.3.1 (2016-06-21) -- "Bug in Your Hair"
Copyright (C) 2016 The R Foundation for Statistical Computing
Platform: x86_64-pc-linux-gnu (64-bit)

R is free software and comes with ABSOLUTELY NO WARRANTY.
You are welcome to redistribute it under certain conditions.
Type 'license()' or 'licence()' for distribution details.

R is a collaborative project with many contributors.
Type 'contributors()' for more information and
'citation()' on how to cite R or R packages in publications.

Type 'demo()' for some demos, 'help()' for on-line help, or
'help.start()' for an HTML browser interface to help.
Type 'q()' to quit R.

> library(AnalyzeTS)
Loading required package: MASS
Loading required package: TSA
Loading required package: leaps
Loading required package: locfit
locfit 1.5-9.1 	 2013-03-22
Loading required package: mgcv
Loading required package: nlme
This is mgcv 1.8-12. For overview type 'help("mgcv-package")'.
Loading required package: tseries

Attaching package: 'TSA'

The following objects are masked from 'package:stats':

    acf, arima

The following object is masked from 'package:utils':

    tar

Loading required package: TTR
> png(filename="/home/ddbj/snapshot/RGM3/R_CC/result/AnalyzeTS/sanility.Rd_%03d_medium.png", width=480, height=480)
> ### Name: sanility
> ### Title: Time Series of Crest of Sanility in Ca Mau Province
> ### Aliases: sanility
> ### Keywords: datasets
>
> ### ** Examples
>
> data(sanility)
> ts.plot(sanility,col="red")
> grid.on()
>
>
>
>
>
> dev.off()
null device
          1
>
|
Created & Maintained by Osamu Ogasawara (osamu.ogasawara@gmail.com) and 