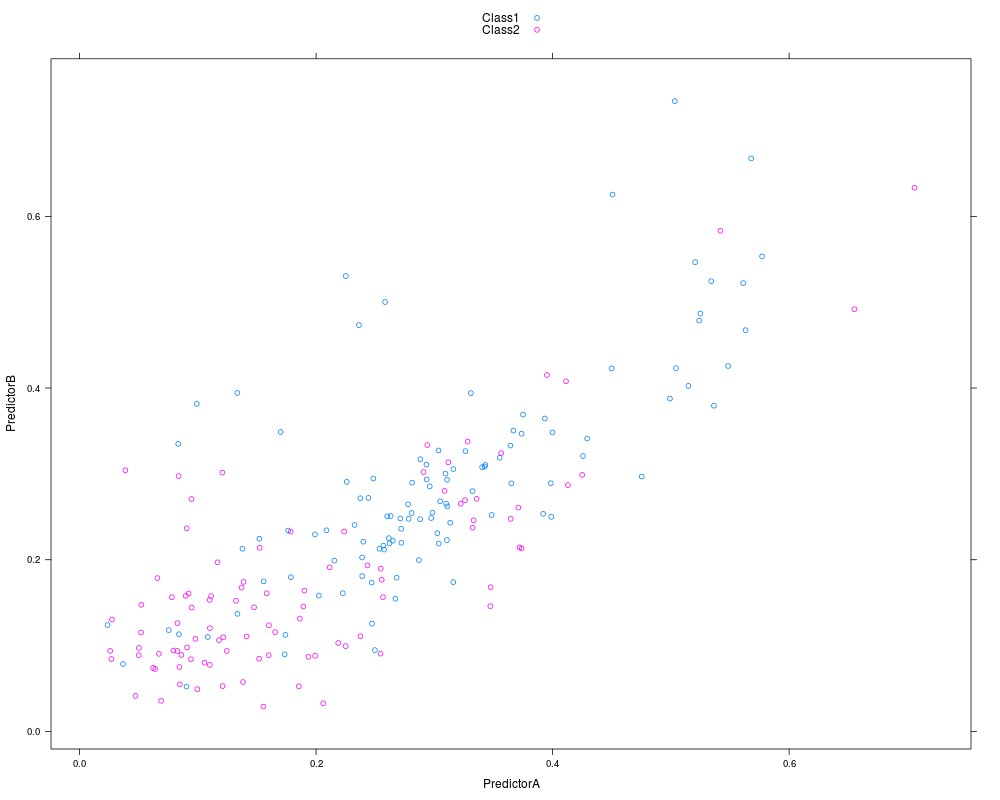
These data contain two predictors measured for 208 samples. Of these, 111 samples are
labeled as Class1 and the remaining 97 are Class2.
Usage
data(twoClassData)
Value
predictors
data frame of two predictors
classes
a factor vector of class labeled
Examples
data(twoClassData)

library(lattice)
xyplot(PredictorB ~ PredictorA,
       data = predictors,
       groups = classes,
       auto.key = TRUE)
Results
R version 3.3.1 (2016-06-21) -- "Bug in Your Hair"
Copyright (C) 2016 The R Foundation for Statistical Computing
Platform: x86_64-pc-linux-gnu (64-bit)

R is free software and comes with ABSOLUTELY NO WARRANTY.
You are welcome to redistribute it under certain conditions.
Type 'license()' or 'licence()' for distribution details.

R is a collaborative project with many contributors.
Type 'contributors()' for more information and
'citation()' on how to cite R or R packages in publications.

Type 'demo()' for some demos, 'help()' for on-line help, or
'help.start()' for an HTML browser interface to help.
Type 'q()' to quit R.

> library(AppliedPredictiveModeling)
> png(filename="/home/ddbj/snapshot/RGM3/R_CC/result/AppliedPredictiveModeling/twoClassData.Rd_%03d_medium.png", width=480, height=480)
> ### Name: twoClassData
> ### Title: Two Class Example Data
> ### Aliases: twoClassData classes
> ### Keywords: datasets
>
> ### ** Examples
>
> data(twoClassData)
>
> library(lattice)
> xyplot(PredictorB ~ PredictorA,
+        data = predictors,
+        groups = classes,
+        auto.key = TRUE)
>
>
>
>
>
>
> dev.off()
null device
          1
>
 .
.