Supported by Dr. Osamu Ogasawara and  . . |
|
Last data update: 2014.03.03 |
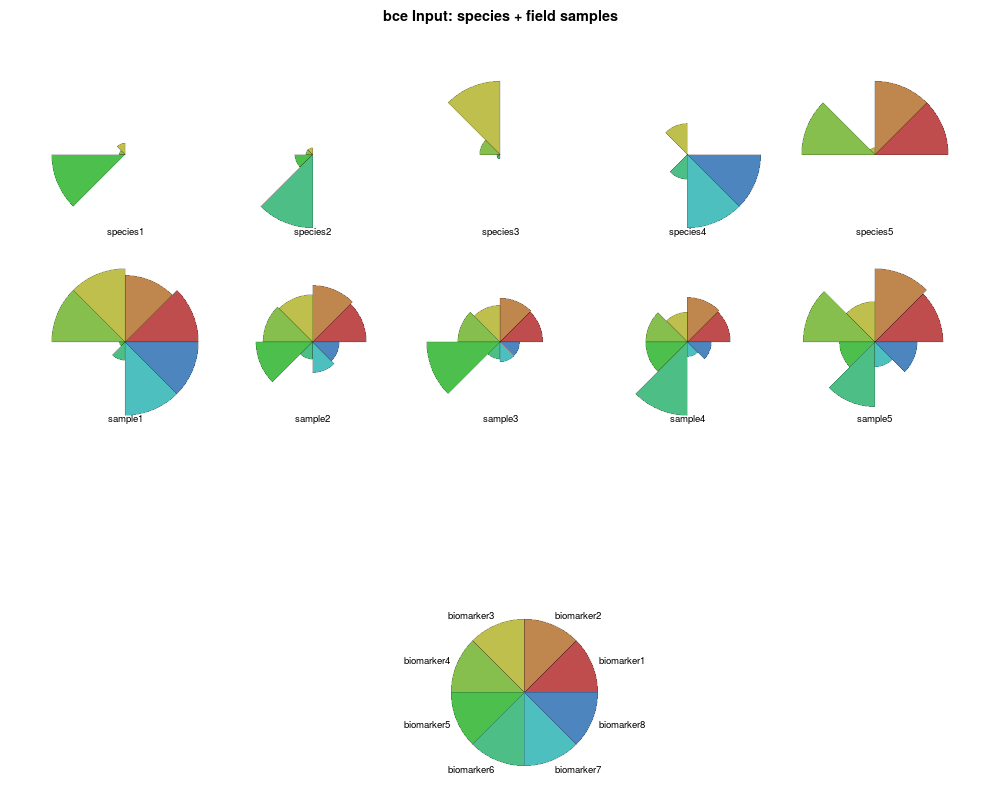
ratiomatrix and datamatrix for demonstration of BCE().DescriptionThe datamatrix contains a set of biomarker measurements for a number of field samples. The ratiomatrix contains biomarker data of a number of biological taxa.
UsagebceInput Examples
##====================================
## Graphical representation of the example input data
palette(rainbow(12, s = 0.6, v = 0.75))

mp     <- apply(bceInput$Rat,MARGIN=2,max)
mp2    <- apply(bceInput$Dat,MARGIN=2,max)
pstars <- rbind(t(t(bceInput$Rat)/mp),t(t(bceInput$Dat)/mp2))

stars(pstars, len = 0.9, key.loc = c(7.2, -2),scale=FALSE,
      ncol=5,ylim=c(0,3),main = "bce Input: species + field samples",
      draw.segments = TRUE, flip.labels=FALSE)
Results
R version 3.3.1 (2016-06-21) -- "Bug in Your Hair"
Copyright (C) 2016 The R Foundation for Statistical Computing
Platform: x86_64-pc-linux-gnu (64-bit)

R is free software and comes with ABSOLUTELY NO WARRANTY.
You are welcome to redistribute it under certain conditions.
Type 'license()' or 'licence()' for distribution details.

R is a collaborative project with many contributors.
Type 'contributors()' for more information and
'citation()' on how to cite R or R packages in publications.

Type 'demo()' for some demos, 'help()' for on-line help, or
'help.start()' for an HTML browser interface to help.
Type 'q()' to quit R.

> library(BCE)
Loading required package: FME
Loading required package: deSolve

Attaching package: 'deSolve'

The following object is masked from 'package:graphics':

    matplot

Loading required package: rootSolve
Loading required package: coda
Loading required package: limSolve
Loading required package: Matrix
> png(filename="/home/ddbj/snapshot/RGM3/R_CC/result/BCE/bceInput.Rd_%03d_medium.png", width=480, height=480)
> ### Name: bceInput
> ### Title: ratiomatrix and datamatrix for demonstration of BCE().
> ### Aliases: bceInput
> ### Keywords: datasets
>
> ### ** Examples
>
> ##====================================
> ## Graphical representation of the example input data
> palette(rainbow(12, s = 0.6, v = 0.75))
>
> mp     <- apply(bceInput$Rat,MARGIN=2,max)
> mp2    <- apply(bceInput$Dat,MARGIN=2,max)
> pstars <- rbind(t(t(bceInput$Rat)/mp),t(t(bceInput$Dat)/mp2))
>
> stars(pstars, len = 0.9, key.loc = c(7.2, -2),scale=FALSE,
+       ncol=5,ylim=c(0,3),main = "bce Input: species + field samples",
+       draw.segments = TRUE, flip.labels=FALSE)
>
>
>
>
>
> dev.off()
null device
          1
>
|
Created & Maintained by Osamu Ogasawara (osamu.ogasawara@gmail.com) and 