Supported by Dr. Osamu Ogasawara and  . . |
|
Last data update: 2014.03.03 |
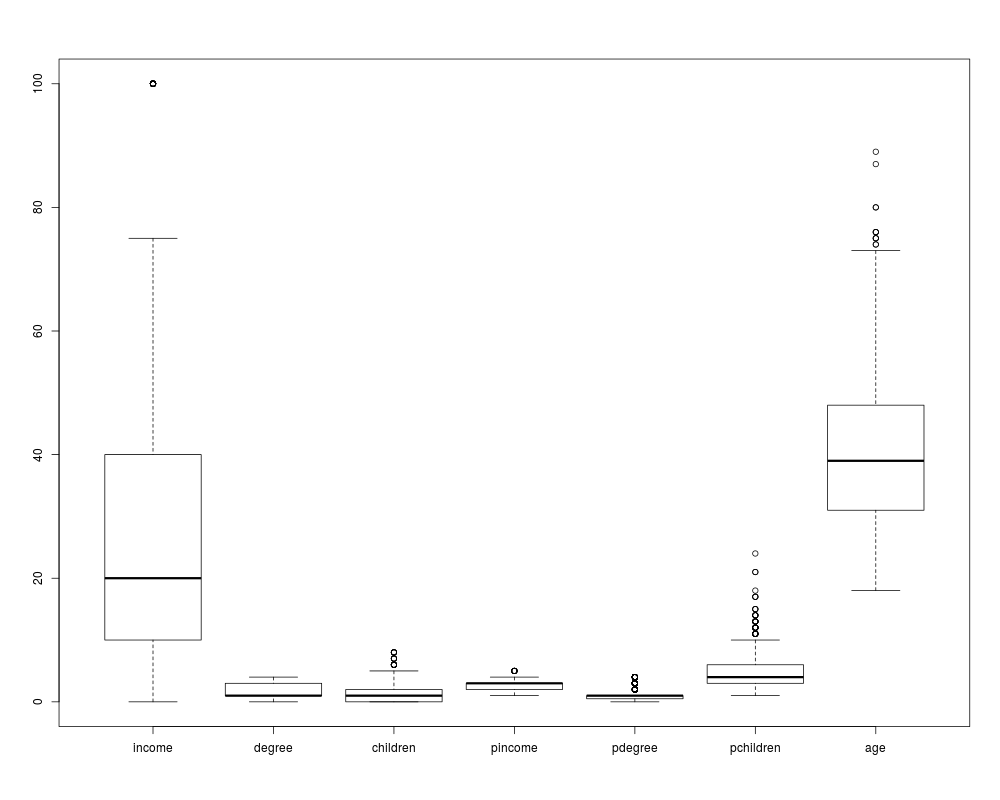
Labor force survey dataDescriptionThe survey dataset concerns 1002 males in the U.S labor force, described by Hoff (2007). The seven observed variables which have been measured on various scales are as follow: the income (income), degree (degree), the number of children (children), parents income (pincome), parents degree (pdegree), number of parents children (pchildren), and age (age). Usagedata( surveyData ) FormatThe format is a matrix with 1002 rows (number of individuals) and 7 column (number of variables). ReferencesHoff, P. (2007). Extending the rank likelihood for semiparametric copula estimation, The Annals of Applied Statistics, 1(1), 265-283. Mohammadi, A. and E. Wit (2015). BDgraph: An Examplesdata( surveyData ) dim( surveyData ) head( surveyData ) boxplot( surveyData ) Results
R version 3.3.1 (2016-06-21) -- "Bug in Your Hair"
Copyright (C) 2016 The R Foundation for Statistical Computing
Platform: x86_64-pc-linux-gnu (64-bit)

R is free software and comes with ABSOLUTELY NO WARRANTY.
You are welcome to redistribute it under certain conditions.
Type 'license()' or 'licence()' for distribution details.

R is a collaborative project with many contributors.
Type 'contributors()' for more information and
'citation()' on how to cite R or R packages in publications.

Type 'demo()' for some demos, 'help()' for on-line help, or
'help.start()' for an HTML browser interface to help.
Type 'q()' to quit R.

> library(BDgraph)
Loading required package: Matrix
Loading required package: igraph

Attaching package: 'igraph'

The following objects are masked from 'package:stats':

    decompose, spectrum

The following object is masked from 'package:base':

    union


Attaching package: 'BDgraph'

The following object is masked from 'package:igraph':

    compare

> png(filename="/home/ddbj/snapshot/RGM3/R_CC/result/BDgraph/surveyData.Rd_%03d_medium.png", width=480, height=480)
> ### Name: surveyData
> ### Title: Labor force survey data
> ### Aliases: surveyData
> ### Keywords: datasets
>
> ### ** Examples
>
> data( surveyData )
> dim( surveyData )
[1] 1002    7
> head( surveyData )
     income degree children pincome pdegree pchildren age
[1,]     NA      1        3       3       1         5  59
[2,]     11      0        3      NA       0         7  59
[3,]      8      1        1      NA       0         9  25
[4,]     25      3        2      NA       0         5  55
[5,]    100      3        2       4       3         2  56
[6,]     40      4        0      NA       4         5  36
> boxplot( surveyData )
>
>
>
>
>
> dev.off()
null device
          1
>
|