Supported by Dr. Osamu Ogasawara and  . . |
|
Last data update: 2014.03.03 |
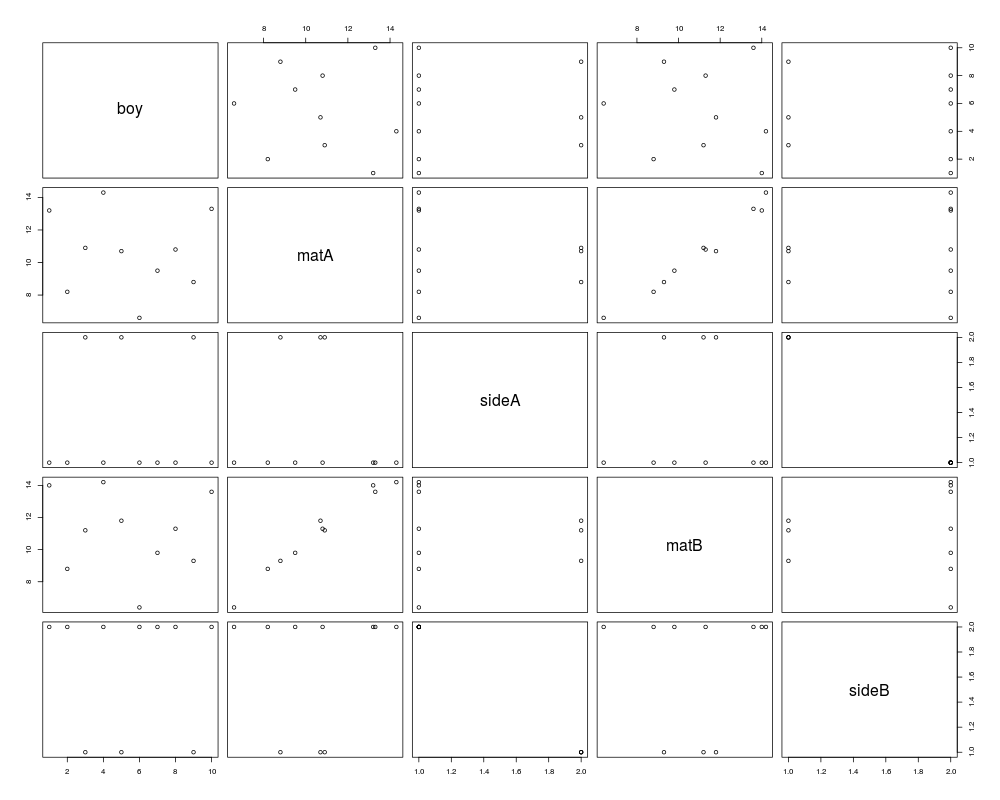
Boys' shoes data setDescriptionData for the Boys' Shoes Example. Usagedata(shoes.data) FormatA data frame with 10 observations on the following 5 variables.
SourceBox G. E. P, Hunter, W. C. and Hunter, J. S. (1978). Statistics for Experimenters. New York: Wiley. ReferencesBox G. E. P, Hunter, J. S. and Hunter, W. C. (2005). Statistics for Experimenters II. New York: Wiley. Examplesdata(shoes.data) str(shoes.data) plot(shoes.data) Results
R version 3.3.1 (2016-06-21) -- "Bug in Your Hair"
Copyright (C) 2016 The R Foundation for Statistical Computing
Platform: x86_64-pc-linux-gnu (64-bit)

R is free software and comes with ABSOLUTELY NO WARRANTY.
You are welcome to redistribute it under certain conditions.
Type 'license()' or 'licence()' for distribution details.

R is a collaborative project with many contributors.
Type 'contributors()' for more information and
'citation()' on how to cite R or R packages in publications.

Type 'demo()' for some demos, 'help()' for on-line help, or
'help.start()' for an HTML browser interface to help.
Type 'q()' to quit R.

> library(BHH2)
> png(filename="/home/ddbj/snapshot/RGM3/R_CC/result/BHH2/shoes.data.Rd_%03d_medium.png", width=480, height=480)
> ### Name: shoes.data
> ### Title: Boys' shoes data set
> ### Aliases: shoes.data
> ### Keywords: datasets
>
> ### ** Examples
>
> data(shoes.data)
> str(shoes.data)
'data.frame':	10 obs. of  5 variables:
 $ boy  : int  1 2 3 4 5 6 7 8 9 10
 $ matA : num  13.2 8.2 10.9 14.3 10.7 6.6 9.5 10.8 8.8 13.3
 $ sideA: Factor w/ 2 levels "L","R": 1 1 2 1 2 1 1 1 2 1
 $ matB : num  14 8.8 11.2 14.2 11.8 6.4 9.8 11.3 9.3 13.6
 $ sideB: Factor w/ 2 levels "L","R": 2 2 1 2 1 2 2 2 1 2
> plot(shoes.data)
>
>
>
>
>
> dev.off()
null device
          1
>
|
Created & Maintained by Osamu Ogasawara (osamu.ogasawara@gmail.com) and 