Supported by Dr. Osamu Ogasawara and  . . |
|
Last data update: 2014.03.03 |
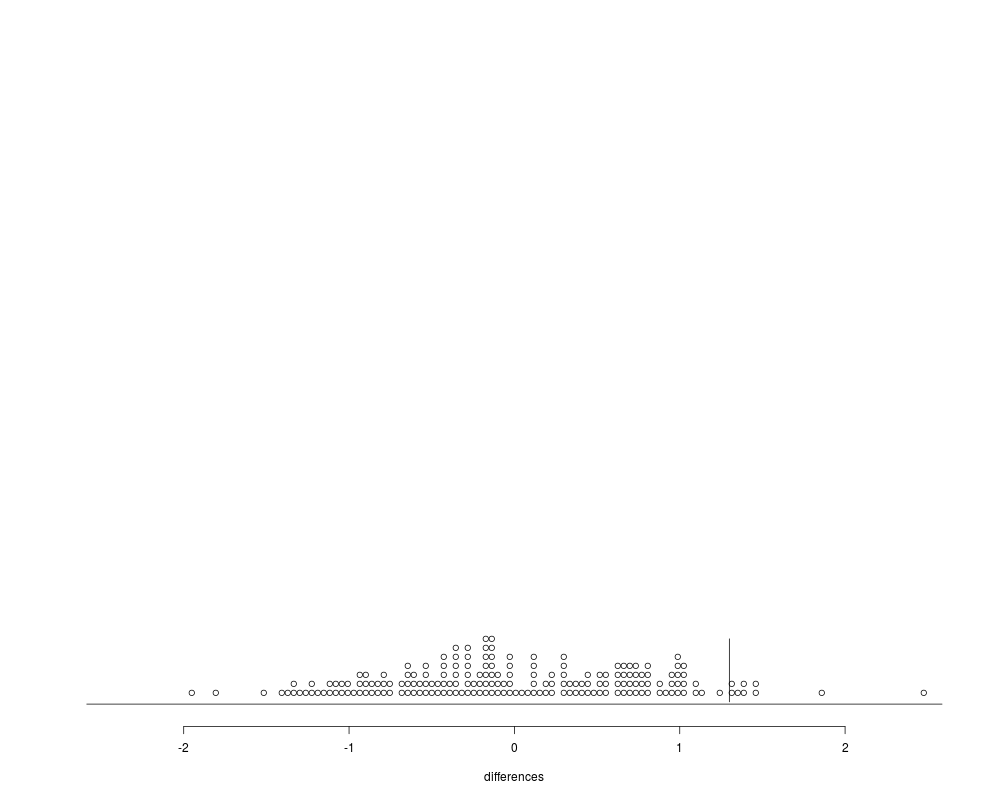
Table 3.3DescriptionReference set of differences between averages of two adjacent sets of 10 successive batches. Usagedata(tab03B2) FormatThis data frame contains the following columns:
DetailsThe SourceBox G. E. P, Hunter, W. C. and Hunter, J. S. (1978). Statistics for Experimenters. New York: Wiley. ReferencesBox G. E. P, Hunter, J. S. and Hunter, W. C. (2005). Statistics for Experimenters II. New York: Wiley. Exampleslibrary(BHH2) data(tab03B2) attach(tab03B2) # displays the differences as dot plot (similar to histograms) plt <- dotPlot(diff10,xlim=2.55*c(-1,+1),xlab="differences") segments(1.3,0,1.3,max(plt$y)) #vertical line at x=1.3 detach() Results
R version 3.3.1 (2016-06-21) -- "Bug in Your Hair"
Copyright (C) 2016 The R Foundation for Statistical Computing
Platform: x86_64-pc-linux-gnu (64-bit)

R is free software and comes with ABSOLUTELY NO WARRANTY.
You are welcome to redistribute it under certain conditions.
Type 'license()' or 'licence()' for distribution details.

R is a collaborative project with many contributors.
Type 'contributors()' for more information and
'citation()' on how to cite R or R packages in publications.

Type 'demo()' for some demos, 'help()' for on-line help, or
'help.start()' for an HTML browser interface to help.
Type 'q()' to quit R.

> library(BHH2)
> png(filename="/home/ddbj/snapshot/RGM3/R_CC/result/BHH2/tab03B2.Rd_%03d_medium.png", width=480, height=480)
> ### Name: tab03B2
> ### Title: Table 3.3
> ### Aliases: tab03B2
> ### Keywords: datasets
>
> ### ** Examples
>
> library(BHH2)
> data(tab03B2)
> attach(tab03B2)
> # displays the differences as dot plot (similar to histograms)
> plt <- dotPlot(diff10,xlim=2.55*c(-1,+1),xlab="differences")
> segments(1.3,0,1.3,max(plt$y))  #vertical line at x=1.3
> detach()
>
>
>
>
>
> dev.off()
null device
          1
>
|
Created & Maintained by Osamu Ogasawara (osamu.ogasawara@gmail.com) and 