Supported by Dr. Osamu Ogasawara and  . . |
|
Last data update: 2014.03.03 |
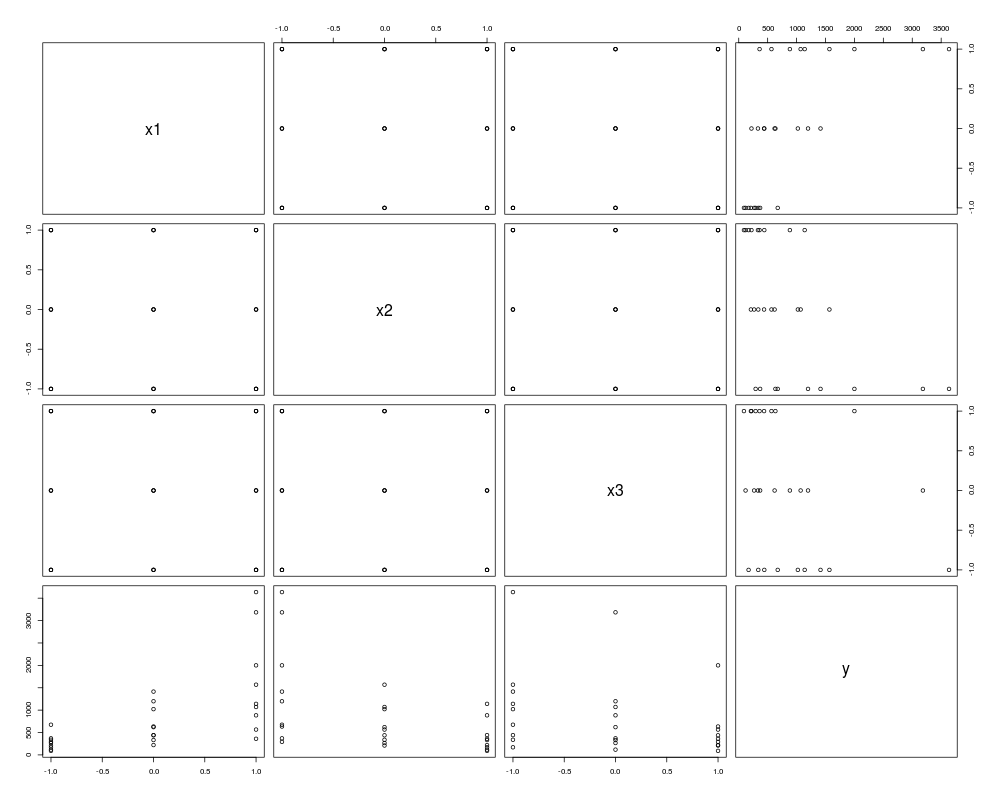
Textile experiment data setDescriptionWoolen thread experiment data set. Usagedata(woolen.data) FormatThis data frame with 27 observations contains the following columns:
SourceBox, G. E. P. and D. R. Cox (1964). "An Analysis of Transformations (with discussion)", Journal of the Royal Statistical Society, Series B, Vol. 26, No. 2, pp. 211–254. ReferencesBox G. E. P, Hunter, J. S. and Hunter, W. C. (2005). Statistics for Experimenters II. New York: Wiley. Examplesdata(woolen.data) str(woolen.data) plot(woolen.data) Results
R version 3.3.1 (2016-06-21) -- "Bug in Your Hair"
Copyright (C) 2016 The R Foundation for Statistical Computing
Platform: x86_64-pc-linux-gnu (64-bit)

R is free software and comes with ABSOLUTELY NO WARRANTY.
You are welcome to redistribute it under certain conditions.
Type 'license()' or 'licence()' for distribution details.

R is a collaborative project with many contributors.
Type 'contributors()' for more information and
'citation()' on how to cite R or R packages in publications.

Type 'demo()' for some demos, 'help()' for on-line help, or
'help.start()' for an HTML browser interface to help.
Type 'q()' to quit R.

> library(BHH2)
> png(filename="/home/ddbj/snapshot/RGM3/R_CC/result/BHH2/woolen.data.Rd_%03d_medium.png", width=480, height=480)
> ### Name: woolen.data
> ### Title: Textile experiment data set
> ### Aliases: woolen.data
> ### Keywords: datasets
>
> ### ** Examples
>
> data(woolen.data)
> str(woolen.data)
'data.frame':	27 obs. of  4 variables:
 $ x1: int  -1 -1 -1 -1 -1 -1 -1 -1 -1 0 ...
 $ x2: int  -1 -1 -1 0 0 0 1 1 1 -1 ...
 $ x3: int  -1 0 1 -1 0 1 -1 0 1 -1 ...
 $ y : int  674 370 292 338 266 210 170 118 90 1414 ...
> plot(woolen.data)
>
>
>
>
>
> dev.off()
null device
          1
>
|
Created & Maintained by Osamu Ogasawara (osamu.ogasawara@gmail.com) and 