Supported by Dr. Osamu Ogasawara and  . . |
|
Last data update: 2014.03.03 |
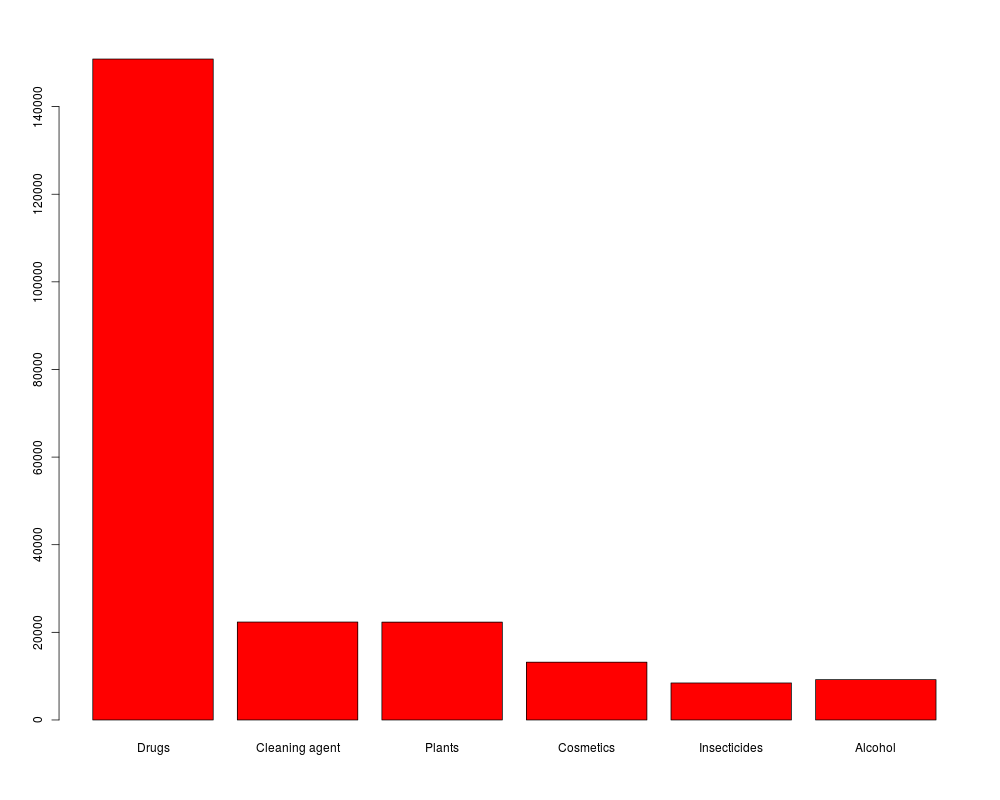
Number of poisonings reported to 16 poison control centersDescriptionData for Exercise 1.113 UsagePoison FormatA data frame with 6 observations on the following 2 variables.
SourceKitchens, L. J. (2003) Basic Statistics and Data Analysis. Duxbury Examplesstr(Poison) attach(Poison) names(number) <- Type barplot(number,col="red") Results
R version 3.3.1 (2016-06-21) -- "Bug in Your Hair"
Copyright (C) 2016 The R Foundation for Statistical Computing
Platform: x86_64-pc-linux-gnu (64-bit)

R is free software and comes with ABSOLUTELY NO WARRANTY.
You are welcome to redistribute it under certain conditions.
Type 'license()' or 'licence()' for distribution details.

R is a collaborative project with many contributors.
Type 'contributors()' for more information and
'citation()' on how to cite R or R packages in publications.

Type 'demo()' for some demos, 'help()' for on-line help, or
'help.start()' for an HTML browser interface to help.
Type 'q()' to quit R.

> library(BSDA)
Loading required package: e1071
Loading required package: lattice

Attaching package: 'BSDA'

The following object is masked from 'package:datasets':

    Orange

> png(filename="/home/ddbj/snapshot/RGM3/R_CC/result/BSDA/Poison.Rd_%03d_medium.png", width=480, height=480)
> ### Name: Poison
> ### Title: Number of poisonings reported to 16 poison control centers
> ### Aliases: Poison
> ### Keywords: datasets
>
> ### ** Examples
>
> str(Poison)
'data.frame':	6 obs. of  2 variables:
 $ Type  : Factor w/ 6 levels "Alcohol","Cleaning agent",..: 4 2 6 3 5 1
 $ number: int  150857 22347 22326 13192 8438 9201
> attach(Poison)
> names(number) <- Type
> barplot(number,col="red")
>
>
>
>
>
> dev.off()
null device
          1
>
|
Created & Maintained by Osamu Ogasawara (osamu.ogasawara@gmail.com) and 