Supported by Dr. Osamu Ogasawara and  . . |
|
Last data update: 2014.03.03 |
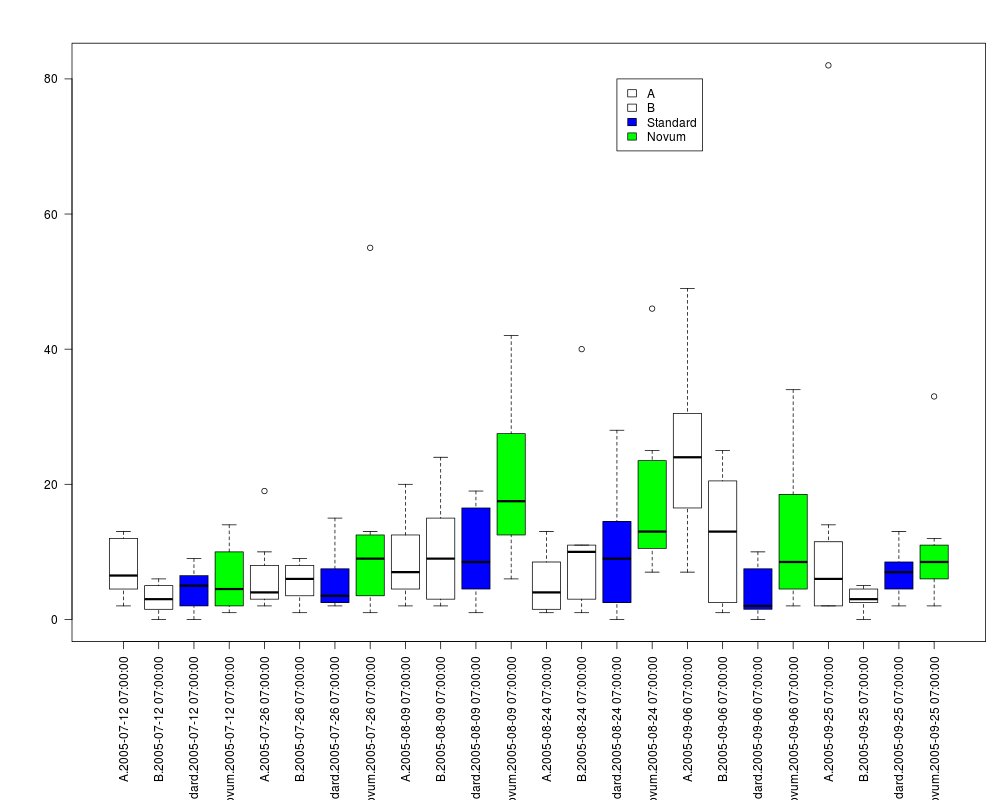
Eklektor counts of BrachyceraDescriptionIn a field trial, 4 treatments were arranged in a randomized complete block design with 8 blocks and 32 plots. Soil eklektor traps were placed in each plot, on six dates from 2005-07-12 to 2005-09-25, the number of individuals of Brachycera (Flies, Order Diptera) hatching from soil were counted. The individuals were classified to the family level. Interest was in assessing potential effects of the novel treatment (Novum) on the abundance of Brachycera, compared to a near standard (Standard) and two additional standard treatments, A and B. Usagedata(Brachycera) FormatA data frame with 192 observations on the following 15 variables.
Source... Examples
data(Brachycera)

par(mar=c(11,5,3,1))

boxplot(Total ~ Treatment*Date, data=Brachycera, las=2,
col=c("white","white","blue","green"))

legend(x=15, y=80, legend=levels(Brachycera$Treatment),
 fill=c("white","white","blue","green"))
Results
R version 3.3.1 (2016-06-21) -- "Bug in Your Hair"
Copyright (C) 2016 The R Foundation for Statistical Computing
Platform: x86_64-pc-linux-gnu (64-bit)

R is free software and comes with ABSOLUTELY NO WARRANTY.
You are welcome to redistribute it under certain conditions.
Type 'license()' or 'licence()' for distribution details.

R is a collaborative project with many contributors.
Type 'contributors()' for more information and
'citation()' on how to cite R or R packages in publications.

Type 'demo()' for some demos, 'help()' for on-line help, or
'help.start()' for an HTML browser interface to help.
Type 'q()' to quit R.

> library(BSagri)
Loading required package: gamlss
Loading required package: splines
Loading required package: gamlss.data
Loading required package: gamlss.dist
Loading required package: MASS
Loading required package: nlme
Loading required package: parallel
 **********   GAMLSS Version 4.4-0  **********
For more on GAMLSS look at http://www.gamlss.org/
Type gamlssNews() to see new features/changes/bug fixes.

Loading required package: multcomp
Loading required package: mvtnorm
Loading required package: survival

Attaching package: 'survival'

The following object is masked from 'package:gamlss.data':

    leukemia

Loading required package: TH.data

Attaching package: 'TH.data'

The following object is masked from 'package:MASS':

    geyser

Loading required package: MCPAN
> png(filename="/home/ddbj/snapshot/RGM3/R_CC/result/BSagri/Brachycera.Rd_%03d_medium.png", width=480, height=480)
> ### Name: Brachycera
> ### Title: Eklektor counts of Brachycera
> ### Aliases: Brachycera
> ### Keywords: datasets
>
> ### ** Examples
>
> data(Brachycera)
>
> par(mar=c(11,5,3,1))
>
> boxplot(Total ~ Treatment*Date, data=Brachycera, las=2,
+ col=c("white","white","blue","green"))
>
> legend(x=15, y=80, legend=levels(Brachycera$Treatment),
+  fill=c("white","white","blue","green"))
>
>
>
>
>
>
> dev.off()
null device
          1
>
|