Supported by Dr. Osamu Ogasawara and  . . |
|
Last data update: 2014.03.03 |
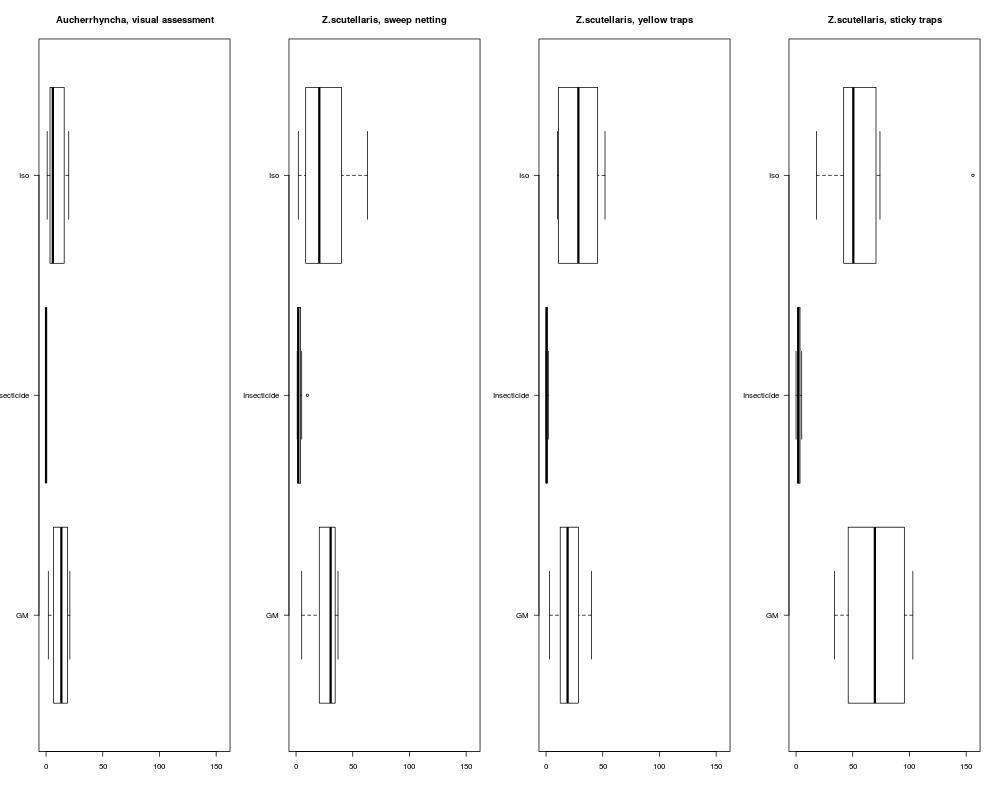
Catches of Planthoppers and LeafhoppersDescriptionData of a field trial concerning the impact of a genetically modified variety on the abundance of Planthoppers and Leafhoppers. The trial was designed as a randomized complete block design with 8 blocks (Row). In each block, three treatments were randomized: a conventional variety treated with insecticides (Insecticide), a genetically modified variety (GM), and the near-isogenic line (Iso) the to genetically modified line. These data originate from the second year of the trial in Cica1. Usagedata(Cica2) FormatA data frame with 24 observations on the following 8 variables.
Source... ReferencesSee Examples
data(Cica2)
# A comparison of the treatments:
layout(matrix(1:4,ncol=4))
ylim<-range(Cica2[,c("Au_Bonitur","Zs_sweep_netting", "Zs_yellow_traps", "Zs_stick_traps")])
boxplot(Au_Bonitur ~ Treatment, data=Cica2,
main= "Aucherrhyncha, visual assessment", ylim=ylim, horizontal=TRUE, las=1)
boxplot(Zs_sweep_netting ~ Treatment, data=Cica2,
main="Z.scutellaris, sweep netting", ylim=ylim, horizontal=TRUE, las=1)
boxplot(Zs_yellow_traps ~ Treatment, data=Cica2,
main="Z.scutellaris, yellow traps", ylim=ylim, horizontal=TRUE, las=1)
boxplot(Zs_stick_traps ~ Treatment, data=Cica2,
main="Z.scutellaris, sticky traps", ylim=ylim, horizontal=TRUE, las=1)
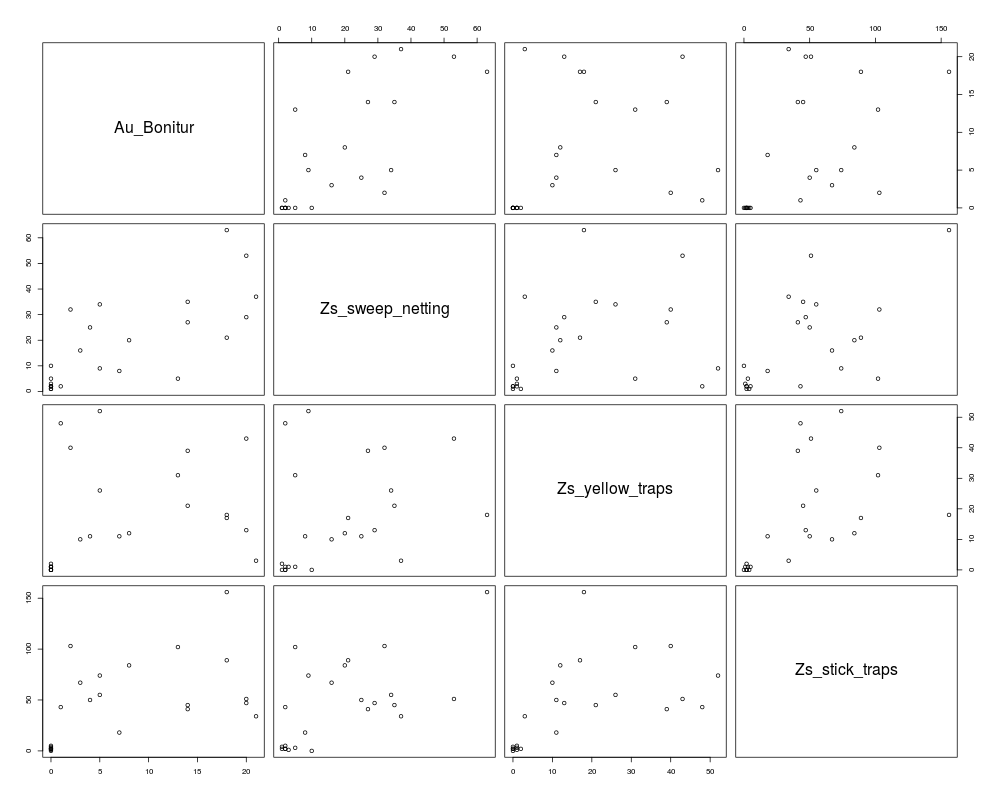
# A comparison of sampling methods:
pairs(Cica2[,c("Au_Bonitur","Zs_sweep_netting", "Zs_yellow_traps", "Zs_stick_traps")])
Results
R version 3.3.1 (2016-06-21) -- "Bug in Your Hair"
Copyright (C) 2016 The R Foundation for Statistical Computing
Platform: x86_64-pc-linux-gnu (64-bit)

R is free software and comes with ABSOLUTELY NO WARRANTY.
You are welcome to redistribute it under certain conditions.
Type 'license()' or 'licence()' for distribution details.

R is a collaborative project with many contributors.
Type 'contributors()' for more information and
'citation()' on how to cite R or R packages in publications.

Type 'demo()' for some demos, 'help()' for on-line help, or
'help.start()' for an HTML browser interface to help.
Type 'q()' to quit R.

> library(BSagri)
Loading required package: gamlss
Loading required package: splines
Loading required package: gamlss.data
Loading required package: gamlss.dist
Loading required package: MASS
Loading required package: nlme
Loading required package: parallel
 **********   GAMLSS Version 4.4-0  **********
For more on GAMLSS look at http://www.gamlss.org/
Type gamlssNews() to see new features/changes/bug fixes.

Loading required package: multcomp
Loading required package: mvtnorm
Loading required package: survival

Attaching package: 'survival'

The following object is masked from 'package:gamlss.data':

    leukemia

Loading required package: TH.data

Attaching package: 'TH.data'

The following object is masked from 'package:MASS':

    geyser

Loading required package: MCPAN
> png(filename="/home/ddbj/snapshot/RGM3/R_CC/result/BSagri/Cica2.Rd_%03d_medium.png", width=480, height=480)
> ### Name: Cica2
> ### Title: Catches of Planthoppers and Leafhoppers
> ### Aliases: Cica2
> ### Keywords: datasets
>
> ### ** Examples
>
> data(Cica2)
>
>
> # A comparison of the treatments:
>
> layout(matrix(1:4,ncol=4))
>
> ylim<-range(Cica2[,c("Au_Bonitur","Zs_sweep_netting", "Zs_yellow_traps", "Zs_stick_traps")])
>
> boxplot(Au_Bonitur ~ Treatment, data=Cica2,
+  main= "Aucherrhyncha, visual assessment", ylim=ylim, horizontal=TRUE, las=1)
>
> boxplot(Zs_sweep_netting ~ Treatment, data=Cica2,
+  main="Z.scutellaris, sweep netting", ylim=ylim, horizontal=TRUE, las=1)
>
> boxplot(Zs_yellow_traps ~ Treatment, data=Cica2,
+  main="Z.scutellaris, yellow traps", ylim=ylim, horizontal=TRUE, las=1)
>
> boxplot(Zs_stick_traps ~ Treatment, data=Cica2,
+  main="Z.scutellaris, sticky traps", ylim=ylim, horizontal=TRUE, las=1)
>
> # A comparison of sampling methods:
>
> pairs(Cica2[,c("Au_Bonitur","Zs_sweep_netting", "Zs_yellow_traps", "Zs_stick_traps")])
>
>
>
>
>
>
> dev.off()
null device
          1
>
|