Supported by Dr. Osamu Ogasawara and  . . |
|
Last data update: 2014.03.03 |
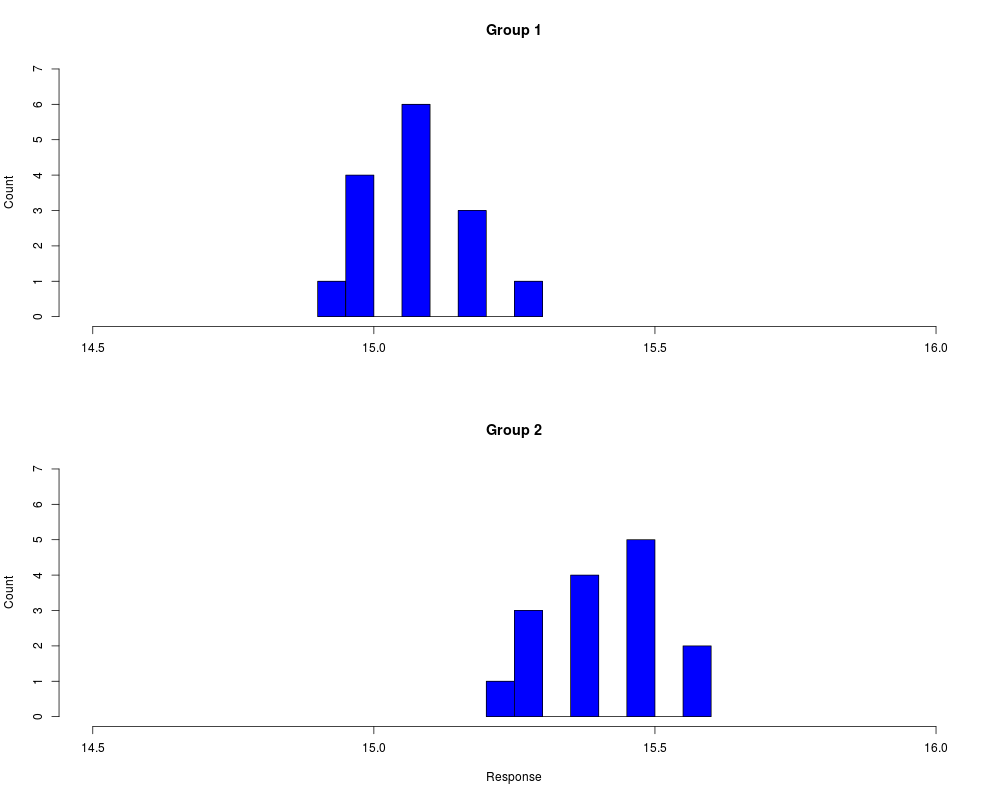
Example univariate response data for MRPPDescriptionHypothetical univariate response data in 2 groups with no outliers (Mielke 1986). Usagedata(example3) FormatA data frame with 30 observations on the following 2 variables.
SourceMielke, P.W. 1986. Non-metric statistical analyses: some metric alternatives. Journal of Statistical Planning and Inference 13, 377–387. Examplespar(mfrow=c(2,1)) hist(example3$response[example3$group==1],breaks = 6,xlim = c(14.5,16), ylim = c(0,7),ylab = "Count",xlab = "",main = "Group 1",col = "blue") hist(example3$response[example3$group==2],breaks = 6,xlim = c(14.5,16), ylim = c(0,7),ylab = "Count",xlab = "Response",main = "Group 2",col = "blue") Results
R version 3.3.1 (2016-06-21) -- "Bug in Your Hair"
Copyright (C) 2016 The R Foundation for Statistical Computing
Platform: x86_64-pc-linux-gnu (64-bit)

R is free software and comes with ABSOLUTELY NO WARRANTY.
You are welcome to redistribute it under certain conditions.
Type 'license()' or 'licence()' for distribution details.

R is a collaborative project with many contributors.
Type 'contributors()' for more information and
'citation()' on how to cite R or R packages in publications.

Type 'demo()' for some demos, 'help()' for on-line help, or
'help.start()' for an HTML browser interface to help.
Type 'q()' to quit R.

> library(Blossom)
> png(filename="/home/ddbj/snapshot/RGM3/R_CC/result/Blossom/example3.Rd_%03d_medium.png", width=480, height=480)
> ### Name: example3
> ### Title: Example univariate response data for MRPP
> ### Aliases: example3
> ### Keywords: datasets
>
> ### ** Examples
>
>
> par(mfrow=c(2,1))
>
> hist(example3$response[example3$group==1],breaks = 6,xlim = c(14.5,16),
+  ylim = c(0,7),ylab = "Count",xlab = "",main = "Group 1",col = "blue")
>
> hist(example3$response[example3$group==2],breaks = 6,xlim = c(14.5,16),
+  ylim = c(0,7),ylab = "Count",xlab = "Response",main = "Group 2",col = "blue")
>
>
>
>
>
> dev.off()
null device
          1
>
|
Created & Maintained by Osamu Ogasawara (osamu.ogasawara@gmail.com) and 