Supported by Dr. Osamu Ogasawara and  . . |
|
Last data update: 2014.03.03 |
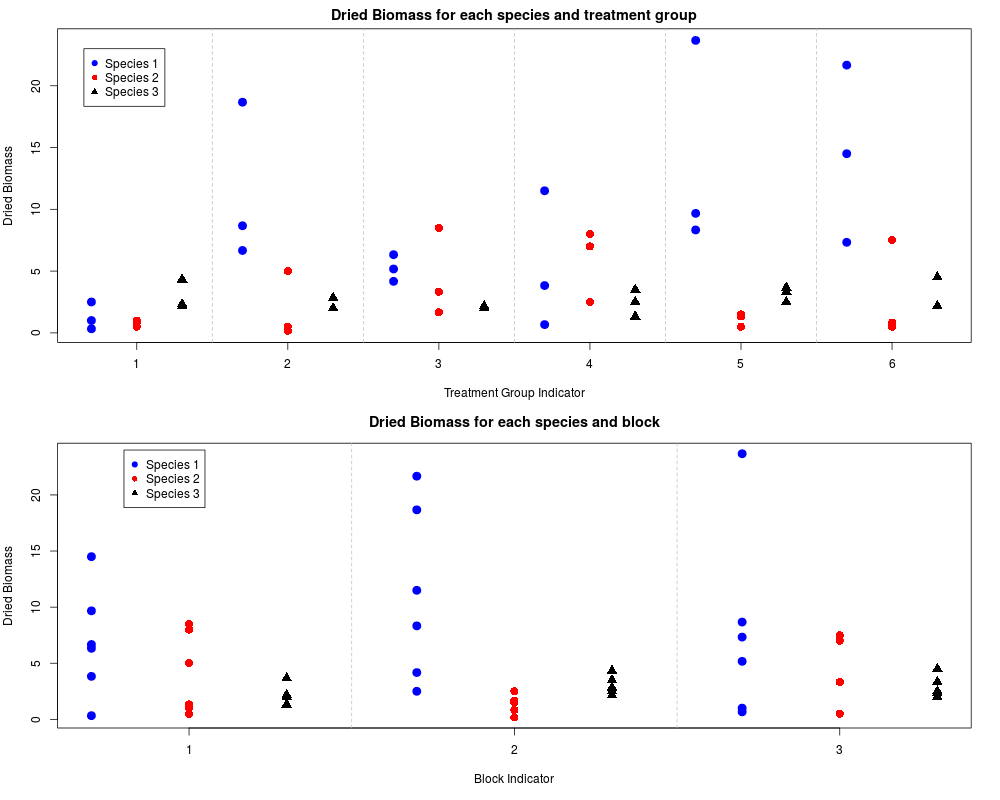
Variation in oven-dried biomass of shrubsDescriptionThe data (Mielke and Iyer 1982) are from a mine reclamation study comparing oven-dried biomass (gm) of 3 species of shrubs in 6 treatments and 3 blocks (different plots). Usagedata(mrbp1) FormatA data frame with 18 observations on the following 5 variables.
SourceMielke, P.W. and H.K. Iyer. 1982. Permutation techniques for analyzing multi-response data from randomized block experiments. Communications in Statistics - Theory and Methods 11, 1427–1437. Examples
str(mrbp1)

par(mfrow = c(2,1),mar = c(4,4,2,2))
plot(rep(mrbp1$trtmt,times = 3)+rep(c(-.3,0,.3),each = 18),c(mrbp1$spp1,mrbp1$spp2,
    mrbp1$spp3),col = rep(c("blue","red","black"),each = nrow(mrbp1)),
    pch = rep(c(19,16,17),each = nrow(mrbp1)),
    xlab = "Treatment Group Indicator",cex = 1.5,ylab = "Dried Biomass",
    main = "Dried Biomass for each species and treatment group")

abline(v = seq(from = 1.5,to = 5.5,by = 1),lty = "dashed",col = "grey")
legend(x = .65, y = 23, legend = c("Species 1","Species 2","Species 3"),
    col = c("blue","red","black"),
    pch = c(19,16,17),bg = "white")

par(mar = c(5,4,3,2))
plot(rep(mrbp1$block,times = 3)+rep(c(-.3,0,.3),each = 18),
    c(mrbp1$spp1,mrbp1$spp2,mrbp1$spp3),col = rep(c("blue","red","black"),
    each = nrow(mrbp1)),pch = rep(c(19,16,17),each = nrow(mrbp1)),
    xlab = "Block Indicator",cex = 1.5,ylab = "Dried Biomass",
    main = "Dried Biomass for each species and block",xaxp = c(1,3,2))

abline(v = seq(from = 1.5,to = 5.5,by = 1),lty = "dashed",col = "grey")
legend(x = .8, y = 24, legend = c("Species 1","Species 2","Species 3"),
     col = c("blue","red","black"),
     pch = c(19,16,17),bg = "white")
Results
R version 3.3.1 (2016-06-21) -- "Bug in Your Hair"
Copyright (C) 2016 The R Foundation for Statistical Computing
Platform: x86_64-pc-linux-gnu (64-bit)

R is free software and comes with ABSOLUTELY NO WARRANTY.
You are welcome to redistribute it under certain conditions.
Type 'license()' or 'licence()' for distribution details.

R is a collaborative project with many contributors.
Type 'contributors()' for more information and
'citation()' on how to cite R or R packages in publications.

Type 'demo()' for some demos, 'help()' for on-line help, or
'help.start()' for an HTML browser interface to help.
Type 'q()' to quit R.

> library(Blossom)
> png(filename="/home/ddbj/snapshot/RGM3/R_CC/result/Blossom/mrbp1.Rd_%03d_medium.png", width=480, height=480)
> ### Name: mrbp1
> ### Title: Variation in oven-dried biomass of shrubs
> ### Aliases: mrbp1
> ### Keywords: datasets
>
> ### ** Examples
>
> str(mrbp1)
'data.frame':	18 obs. of  5 variables:
 $ trtmt: int  1 1 1 2 2 2 3 3 3 4 ...
 $ block: int  1 2 3 1 2 3 1 2 3 1 ...
 $ spp1 : num  0.33 2.5 1 6.67 18.67 ...
 $ spp2 : num  1 0.83 0.5 5 0.17 0.5 8.5 1.67 3.33 8 ...
 $ spp3 : num  2.17 4.33 2.33 2 2.83 2 2.17 2.17 2 1.33 ...
>
> par(mfrow = c(2,1),mar = c(4,4,2,2))
> plot(rep(mrbp1$trtmt,times = 3)+rep(c(-.3,0,.3),each = 18),c(mrbp1$spp1,mrbp1$spp2,
+     mrbp1$spp3),col = rep(c("blue","red","black"),each = nrow(mrbp1)),
+     pch = rep(c(19,16,17),each = nrow(mrbp1)),
+     xlab = "Treatment Group Indicator",cex = 1.5,ylab = "Dried Biomass",
+     main = "Dried Biomass for each species and treatment group")
>
> abline(v = seq(from = 1.5,to = 5.5,by = 1),lty = "dashed",col = "grey")
> legend(x = .65, y = 23, legend = c("Species 1","Species 2","Species 3"),
+     col = c("blue","red","black"),
+     pch = c(19,16,17),bg = "white")
>
> par(mar = c(5,4,3,2))
> plot(rep(mrbp1$block,times = 3)+rep(c(-.3,0,.3),each = 18),
+     c(mrbp1$spp1,mrbp1$spp2,mrbp1$spp3),col = rep(c("blue","red","black"),
+     each = nrow(mrbp1)),pch = rep(c(19,16,17),each = nrow(mrbp1)),
+     xlab = "Block Indicator",cex = 1.5,ylab = "Dried Biomass",
+     main = "Dried Biomass for each species and block",xaxp = c(1,3,2))
>
> abline(v = seq(from = 1.5,to = 5.5,by = 1),lty = "dashed",col = "grey")
> legend(x = .8, y = 24, legend = c("Species 1","Species 2","Species 3"),
+      col = c("blue","red","black"),
+      pch = c(19,16,17),bg = "white")
>
>
>
>
>
> dev.off()
null device
          1
>
|