Supported by Dr. Osamu Ogasawara and  . . |
|
Last data update: 2014.03.03 |
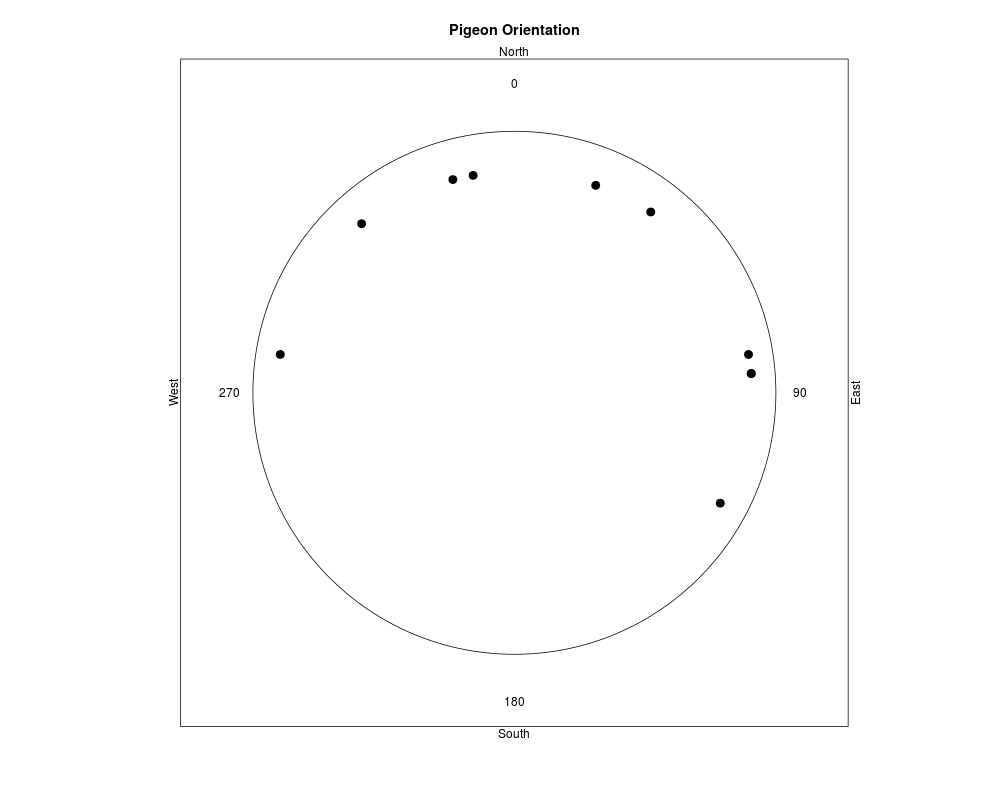
Circular orientation of homing pigeons (Rao 1976)DescriptionThe angular degree orientation of 10 homing pigeons used by Rao (1976) for his spacing test of uniformity on a circular distribution. Usagedata(rao) FormatA data frame with 10 observations on the following variable.
SourceRao, J.S. 1976. Some tests based on arc-lengths for the circle. Sankhya, Series B 38,329–338. Examples
str(rao)
par(pty = "s")
plot(c(-1.3,1.3),c(-1.4,1.4),type = "n",xaxt = "n",yaxt = "n",xlab = "",ylab = "",
  main = "Pigeon Orientation")
  symbols(x = 0, y = 0, circles = 1.1,add = TRUE,fg = seq(1:10),inch = FALSE)
  points(unlist(sin(rao*pi/180)),unlist(cos(rao*pi/180)),pch = 19,cex = 1.5)
  mtext(text = c("North","East","South","West"), side = c(3,4,1,2))

  text(x = 0,y = 1.4,"0")
  text(x = 1.2,y = 0,"90")
  text(x = 0,y = -1.4,"180")
  text(x = -1.2,y = 0,"270")
Results
R version 3.3.1 (2016-06-21) -- "Bug in Your Hair"
Copyright (C) 2016 The R Foundation for Statistical Computing
Platform: x86_64-pc-linux-gnu (64-bit)

R is free software and comes with ABSOLUTELY NO WARRANTY.
You are welcome to redistribute it under certain conditions.
Type 'license()' or 'licence()' for distribution details.

R is a collaborative project with many contributors.
Type 'contributors()' for more information and
'citation()' on how to cite R or R packages in publications.

Type 'demo()' for some demos, 'help()' for on-line help, or
'help.start()' for an HTML browser interface to help.
Type 'q()' to quit R.

> library(Blossom)
> png(filename="/home/ddbj/snapshot/RGM3/R_CC/result/Blossom/rao.Rd_%03d_medium.png", width=480, height=480)
> ### Name: rao
> ### Title: Circular orientation of homing pigeons (Rao 1976)
> ### Aliases: rao
> ### Keywords: datasets
>
> ### ** Examples
>
>
> str(rao)
'data.frame':	10 obs. of  1 variable:
 $ angl: int  20 35 350 120 85 345 80 320 280 85
> par(pty = "s")
> plot(c(-1.3,1.3),c(-1.4,1.4),type = "n",xaxt = "n",yaxt = "n",xlab = "",ylab = "",
+   main = "Pigeon Orientation")
>   symbols(x = 0, y = 0, circles = 1.1,add = TRUE,fg = seq(1:10),inch = FALSE)
>   points(unlist(sin(rao*pi/180)),unlist(cos(rao*pi/180)),pch = 19,cex = 1.5)
>   mtext(text = c("North","East","South","West"), side = c(3,4,1,2))
>
>   text(x = 0,y = 1.4,"0")
>   text(x = 1.2,y = 0,"90")
>   text(x = 0,y = -1.4,"180")
>   text(x = -1.2,y = 0,"270")
>
>
>
>
>
>
> dev.off()
null device
          1
>
|
Created & Maintained by Osamu Ogasawara (osamu.ogasawara@gmail.com) and 