Supported by Dr. Osamu Ogasawara and  . . |
|
Last data update: 2014.03.03 |
Mutual Information for Protein Secondary Structure PredictionDescriptionArrays containing values of mutual information for single residues ( Usage
data("HEC_MI1")
data("HEC_MI2")
FormatThe format of HEC_MI1 is: num [1:20, 1:21, 1:3] 0.04264 -0.00117 0.02641 0.08264 -0.04876 ... - attr(*, "dimnames")=List of 3 ..$ : chr [1:20] "A" "R" "N" "D" ... ..$ : chr [1:21] "-10" "-9" "-8" "-7" ... ..$ : chr [1:3] "H" "E" "C" The format of HEC_MI2 is: num [1:20, 1:20, 1:21, 1:21, 1:3] 2.56 -Inf -Inf -Inf -Inf ... - attr(*, "dimnames")=List of 5 ..$ : chr [1:20] "A" "R" "N" "D" ... ..$ : chr [1:20] "A" "R" "N" "D" ... ..$ : chr [1:21] "-10" "-9" "-8" "-7" ... ..$ : chr [1:21] "-10" "-9" "-8" "-7" ... ..$ : chr [1:3] "H" "E" "C" DetailsThe values in each matrix were derived based on a set of 15,201 proteins in the ASTRAL Compendium (Chandonia, 2004). The 8-states assigned by the Dictionary of Protein Secondary Structure (DSSP) were reduced to 3-states via H = G, H, or I; E = E; and C = B, S, C, or T. ReferencesChandonia, J. M. (2004). The ASTRAL Compendium in 2004. Nucleic Acids Research, 32(90001), 189D-192. doi:10.1093/nar/gkh034. Examples
data(HEC_MI1)
# the contribution of an arginine ("R")
# located 3 residues left of center
# to a helical ("H") state at the center
HEC_MI1["R", "-3", "H"]
data(HEC_MI2)
# the contribution of arginine and lysine ("K")
# located at positions -1 and +1, respectively
# to a coil ("C") state at the center position
HEC_MI2["R", "K", "-1", "1", "C"]
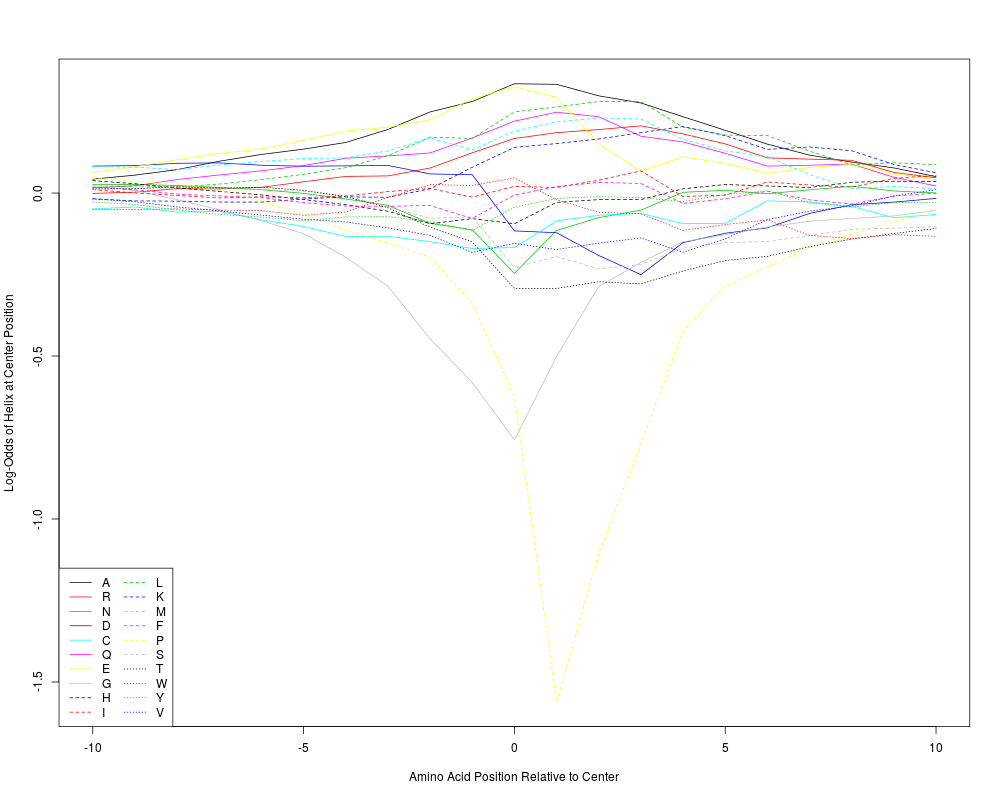
matplot(-10:10, t(HEC_MI1[,, "H"]),
type="l", col=1:8, lty=rep(1:3, each=8),
xlab="Amino Acid Position Relative to Center",
ylab="Log-Odds of Helix at Center Position")
legend("bottomleft",
lwd=1, col=1:8, lty=rep(1:3, each=8),
legend=dimnames(HEC_MI1)[[1]], ncol=2)
Results
R version 3.3.1 (2016-06-21) -- "Bug in Your Hair"
Copyright (C) 2016 The R Foundation for Statistical Computing
Platform: x86_64-pc-linux-gnu (64-bit)

R is free software and comes with ABSOLUTELY NO WARRANTY.
You are welcome to redistribute it under certain conditions.
Type 'license()' or 'licence()' for distribution details.

R is a collaborative project with many contributors.
Type 'contributors()' for more information and
'citation()' on how to cite R or R packages in publications.

Type 'demo()' for some demos, 'help()' for on-line help, or
'help.start()' for an HTML browser interface to help.
Type 'q()' to quit R.

> library(DECIPHER)
Loading required package: Biostrings
Loading required package: BiocGenerics
Loading required package: parallel

Attaching package: 'BiocGenerics'

The following objects are masked from 'package:parallel':

    clusterApply, clusterApplyLB, clusterCall, clusterEvalQ,
    clusterExport, clusterMap, parApply, parCapply, parLapply,
    parLapplyLB, parRapply, parSapply, parSapplyLB

The following objects are masked from 'package:stats':

    IQR, mad, xtabs

The following objects are masked from 'package:base':

    Filter, Find, Map, Position, Reduce, anyDuplicated, append,
    as.data.frame, cbind, colnames, do.call, duplicated, eval, evalq,
    get, grep, grepl, intersect, is.unsorted, lapply, lengths, mapply,
    match, mget, order, paste, pmax, pmax.int, pmin, pmin.int, rank,
    rbind, rownames, sapply, setdiff, sort, table, tapply, union,
    unique, unsplit

Loading required package: S4Vectors
Loading required package: stats4

Attaching package: 'S4Vectors'

The following objects are masked from 'package:base':

    colMeans, colSums, expand.grid, rowMeans, rowSums

Loading required package: IRanges
Loading required package: XVector
Loading required package: RSQLite
Loading required package: DBI
> png(filename="/home/ddbj/snapshot/RGM3/R_BC/result/DECIPHER/HEC_MI.Rd_%03d_medium.png", width=480, height=480)
> ### Name: HEC_MI
> ### Title: Mutual Information for Protein Secondary Structure Prediction
> ### Aliases: HEC_MI1 HEC_MI2
> ### Keywords: datasets
>
> ### ** Examples
>
> data(HEC_MI1)
> # the contribution of an arginine ("R")
> # located 3 residues left of center
> # to a helical ("H") state at the center
> HEC_MI1["R", "-3", "H"]
[1] 0.0525285
>
> data(HEC_MI2)
> # the contribution of arginine and lysine ("K")
> # located at positions -1 and +1, respectively
> # to a coil ("C") state at the center position
> HEC_MI2["R", "K", "-1", "1", "C"]
[1] -0.2300684
>
> matplot(-10:10, t(HEC_MI1[,, "H"]),
+        type="l", col=1:8, lty=rep(1:3, each=8),
+        xlab="Amino Acid Position Relative to Center",
+        ylab="Log-Odds of Helix at Center Position")
> legend("bottomleft",
+        lwd=1, col=1:8, lty=rep(1:3, each=8),
+        legend=dimnames(HEC_MI1)[[1]], ncol=2)
>
>
>
>
>
> dev.off()
null device
          1
>
|