Supported by Dr. Osamu Ogasawara and  . . |
|
Last data update: 2014.03.03 |
US Finance Industry ProfitsDescriptionA Usagedata(USFinanceIndustry) Format A
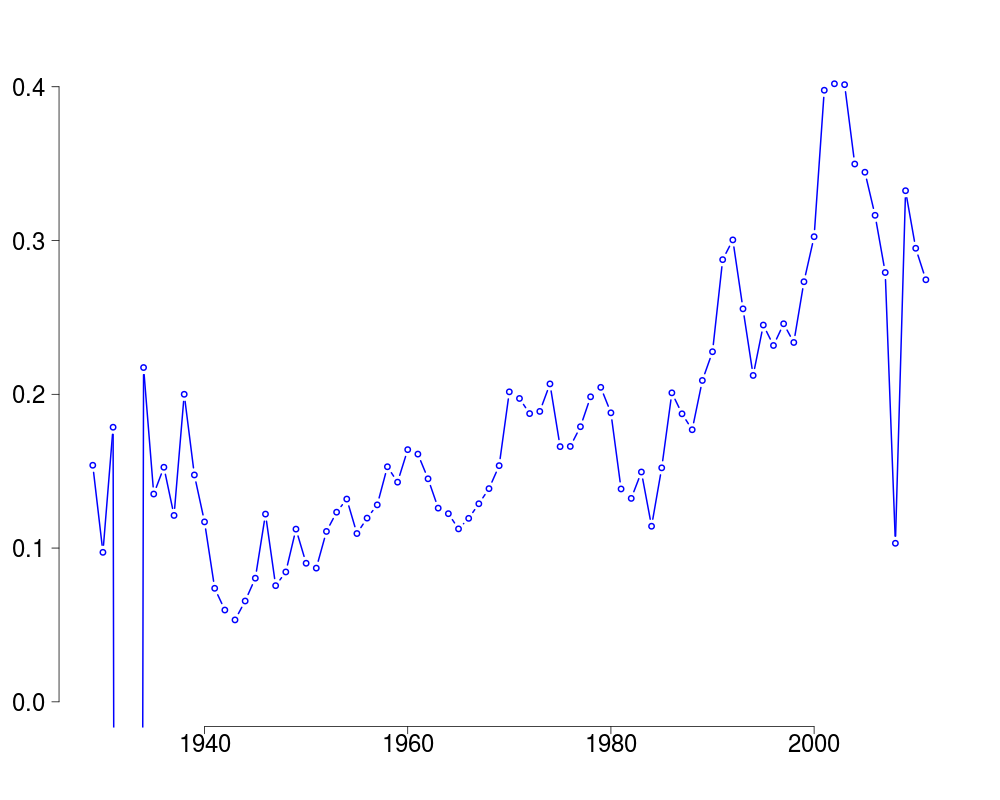
DetailsThis is extracted from Table 6.16 of the National Income and Product Accounts (NIPA) copiled by the Bureau of Economic Analysis of the United States federal government. This table comes in four parts, A (1929-1947), B (1948-1987), C (1987-2000), and D (1998-present). Parts A, B, C and D contain different numbers of data elements, but the first five have the same names and are the only ones used here. The overlap between parts C and D (1998-2000) have a root mean square relative difference of 0.7 percent; there were no differences between the numbers in the overlap period between parts B and C (1987). This was created using the following command: demoDir <- system.file('demoFiles', package='Ecdat') demoCsv <- dir(demoDir, pattern='csv$', full.names=TRUE) nipa6.16 <- readNIPA(demoCsv) USFinanceIndustry <- as.data.frame(nipa6.16) names(USFinanceIndustry) <- c('year', 'CorporateProfitsAdj', 'Domestic', 'Financial', 'Nonfinancial', 'restOfWorld') USFinanceIndustry$FinanceProportion <- with(USFinanceIndustry, Financial/Domestic) Sourcehttp://www.bea.gov: Under "U.S. Economic Accounts", first
select "Corporate Profits" under "National". Then next to
"Interactive Tables", select, "National Income and Product Accounts
Tables". From there, select "Begin using the data...". Under
"Section 6 - income and employment by industry", select each of the
tables starting "Table 6.16". As of February 2013, there were 4 such
tables available: Table 6.16A, 6.16B, 6.16C and 6.16D. Each of the
last three are available in annual and quarterly summaries. The
See Also
Examples
data(USFinanceIndustry)
plot(FinanceProportion~year, USFinanceIndustry, type='b',
     ylim=c(0, max(FinanceProportion, na.rm=TRUE)),
     xlab='', ylab='', las=1, cex.axis=2, bty='n', lwd=2,
     col='blue')

# Write to a file for Wikimedia Commons
svg('USFinanceIndustry.svg')
plot(FinanceProportion~year, USFinanceIndustry, type='b',
     ylim=c(0, max(FinanceProportion, na.rm=TRUE)),
     xlab='', ylab='', las=1, cex.axis=2, bty='n', lwd=2,
     col='blue')
dev.off()
Results
R version 3.3.1 (2016-06-21) -- "Bug in Your Hair"
Copyright (C) 2016 The R Foundation for Statistical Computing
Platform: x86_64-pc-linux-gnu (64-bit)

R is free software and comes with ABSOLUTELY NO WARRANTY.
You are welcome to redistribute it under certain conditions.
Type 'license()' or 'licence()' for distribution details.

R is a collaborative project with many contributors.
Type 'contributors()' for more information and
'citation()' on how to cite R or R packages in publications.

Type 'demo()' for some demos, 'help()' for on-line help, or
'help.start()' for an HTML browser interface to help.
Type 'q()' to quit R.

> library(Ecdat)
Loading required package: Ecfun

Attaching package: 'Ecfun'

The following object is masked from 'package:base':

    sign


Attaching package: 'Ecdat'

The following object is masked from 'package:datasets':

    Orange

> png(filename="/home/ddbj/snapshot/RGM3/R_CC/result/Ecdat/USFinanceIndustry.Rd_%03d_medium.png", width=480, height=480)
> ### Name: USFinanceIndustry
> ### Title: US Finance Industry Profits
> ### Aliases: USFinanceIndustry
> ### Keywords: datasets
>
> ### ** Examples
>
> data(USFinanceIndustry)
> plot(FinanceProportion~year, USFinanceIndustry, type='b',
+      ylim=c(0, max(FinanceProportion, na.rm=TRUE)),
+      xlab='', ylab='', las=1, cex.axis=2, bty='n', lwd=2,
+      col='blue')
>
> # Write to a file for Wikimedia Commons
> svg('USFinanceIndustry.svg')
> plot(FinanceProportion~year, USFinanceIndustry, type='b',
+      ylim=c(0, max(FinanceProportion, na.rm=TRUE)),
+      xlab='', ylab='', las=1, cex.axis=2, bty='n', lwd=2,
+      col='blue')
> dev.off()
png
  2
>
>
>
>
>
> dev.off()
null device
          1
>
|