Supported by Dr. Osamu Ogasawara and  . . |
|
Last data update: 2014.03.03 |
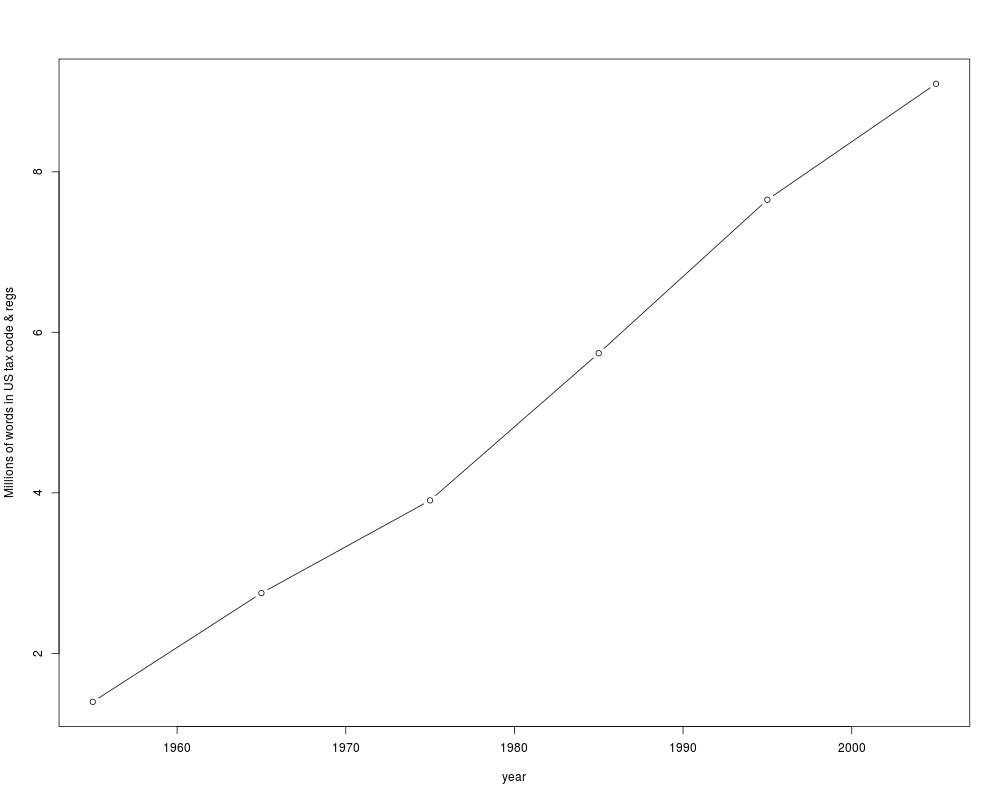
Number of Words in US Tax LawDescriptionThousdands of words in US tax law for 1995 to 2005 in 10 year intervals. This includes income taxes and all taxes in the code itself (written by congress) and regulations (written by government administrators). Usagedata(UStaxWords) FormatA
DetailsThousands of words in the US tax code and federal tax regulations,
1955-2005. This is based on data from the Tax Foundation
(taxfoundation.org), adjusted to eliminate an obvious questionable
observation in The decline of 48 percent seems more curious for two additional
reasons: First, it was preceeded by a tripling of
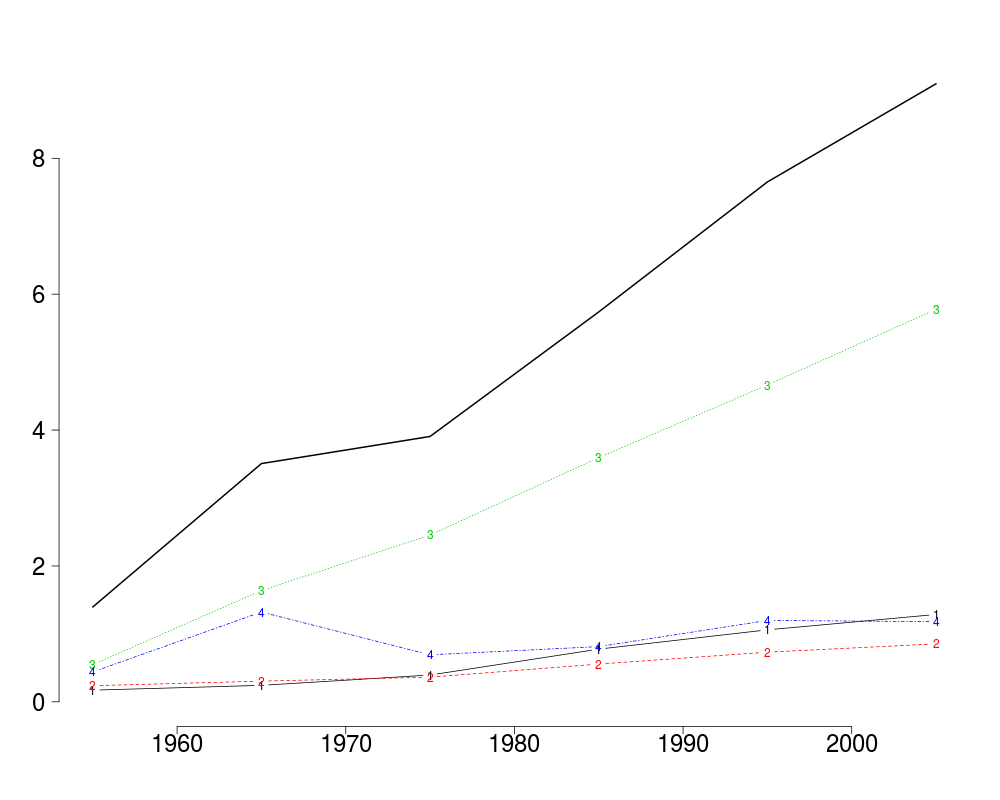
Accordingly, Independent of whether this adjustment is correct or not, it's clear that there have been roughly 3 words of regulations for each word in the tax code. Most of these are income tax regulations, which have recently contained 4.5 words for every word in code. The income tax code currently includes roughly 50 percent more words than other tax code. Author(s)Spencer Graves SourceTax Foundation: Number of Words in Internal Revenue Code and Federal Tax Regulations, 1955-2005 ReferencesJ. Scott Moody, Wendy P. Warcholik, and Scott A. Hodge (2005) "The Rising Cost of Complying with the Federal Income Tax", The Tax Foundation Special Report No. 138. Examples
data(UStaxWords)
plot(EntireTaxCodeAndRegs/1000 ~ year, UStaxWords, type='b',
     ylab='Millions of words in US tax code & regs')

# Write to a file for Wikimedia Commons
svg('UStaxWords.svg')
matplot(UStaxWords$year, UStaxWords[c(2:3, 5:6)]/1000,
      type='b', bty='n', ylab='',
      ylim=c(0, max(UStaxWords$EntireTaxCodeAndRegs)/1000),
      las=1, xlab="", cex.axis=2)
lines(EntireTaxCodeAndRegs/1000~year, UStaxWords, lwd=2)
dev.off()
# lines 1:4 = IncomeTaxCode, otherTaxCode, IncomeTaxRegulations,
# and otherTaxRegulations, respectively

##
## Plotting the original numbers without the adjustment
##
UStax. <- UStaxWords
UStax.[2,c(6:7, 9:10)] <- c(1322, 2960, 1626, 3507)
matplot(UStax.$year, UStax.[c(2:3, 5:6)]/1000,
      type='b', bty='n', ylab='',
      ylim=c(0, max(UStax.$EntireTaxCodeAndRegs)/1000),
      las=1, xlab="", cex.axis=2)
lines(EntireTaxCodeAndRegs/1000~year, UStax., lwd=2)
# Note especially the anomalous behaviour of line 4 =
# otherTaxRegulations.  As noted with "details" above,
# otherTaxRegulations could have tripled between 1955 and 1965,
# then fallen by 48 percent between 1965 and 1975.  However,
# that does not seem credible, especially since there was no
# corresponding behavior in otherTaxCode.
Results
R version 3.3.1 (2016-06-21) -- "Bug in Your Hair"
Copyright (C) 2016 The R Foundation for Statistical Computing
Platform: x86_64-pc-linux-gnu (64-bit)

R is free software and comes with ABSOLUTELY NO WARRANTY.
You are welcome to redistribute it under certain conditions.
Type 'license()' or 'licence()' for distribution details.

R is a collaborative project with many contributors.
Type 'contributors()' for more information and
'citation()' on how to cite R or R packages in publications.

Type 'demo()' for some demos, 'help()' for on-line help, or
'help.start()' for an HTML browser interface to help.
Type 'q()' to quit R.

> library(Ecdat)
Loading required package: Ecfun

Attaching package: 'Ecfun'

The following object is masked from 'package:base':

    sign


Attaching package: 'Ecdat'

The following object is masked from 'package:datasets':

    Orange

> png(filename="/home/ddbj/snapshot/RGM3/R_CC/result/Ecdat/UStaxWords.Rd_%03d_medium.png", width=480, height=480)
> ### Name: UStaxWords
> ### Title: Number of Words in US Tax Law
> ### Aliases: UStaxWords
> ### Keywords: datasets
>
> ### ** Examples
>
> data(UStaxWords)
> plot(EntireTaxCodeAndRegs/1000 ~ year, UStaxWords, type='b',
+      ylab='Millions of words in US tax code & regs')
>
> # Write to a file for Wikimedia Commons
> svg('UStaxWords.svg')
> matplot(UStaxWords$year, UStaxWords[c(2:3, 5:6)]/1000,
+       type='b', bty='n', ylab='',
+       ylim=c(0, max(UStaxWords$EntireTaxCodeAndRegs)/1000),
+       las=1, xlab="", cex.axis=2)
> lines(EntireTaxCodeAndRegs/1000~year, UStaxWords, lwd=2)
> dev.off()
png
  2
> # lines 1:4 = IncomeTaxCode, otherTaxCode, IncomeTaxRegulations,
> # and otherTaxRegulations, respectively
>
> ##
> ## Plotting the original numbers without the adjustment
> ##
> UStax. <- UStaxWords
> UStax.[2,c(6:7, 9:10)] <- c(1322, 2960, 1626, 3507)
> matplot(UStax.$year, UStax.[c(2:3, 5:6)]/1000,
+       type='b', bty='n', ylab='',
+       ylim=c(0, max(UStax.$EntireTaxCodeAndRegs)/1000),
+       las=1, xlab="", cex.axis=2)
> lines(EntireTaxCodeAndRegs/1000~year, UStax., lwd=2)
> # Note especially the anomalous behaviour of line 4 =
> # otherTaxRegulations.  As noted with "details" above,
> # otherTaxRegulations could have tripled between 1955 and 1965,
> # then fallen by 48 percent between 1965 and 1975.  However,
> # that does not seem credible, especially since there was no
> # corresponding behavior in otherTaxCode.
>
>
>
>
>
> dev.off()
null device
          1
>
|