Supported by Dr. Osamu Ogasawara and  . . |
|
Last data update: 2014.03.03 |
Countries in Banking CrisesDescriptionA Usagedata(bankingCrises) Format A DetailsThis file was created using the following command: bankingCrises <- readFinancialCrisisFiles(FinancialCrisisFiles) This is documented further in the help file for
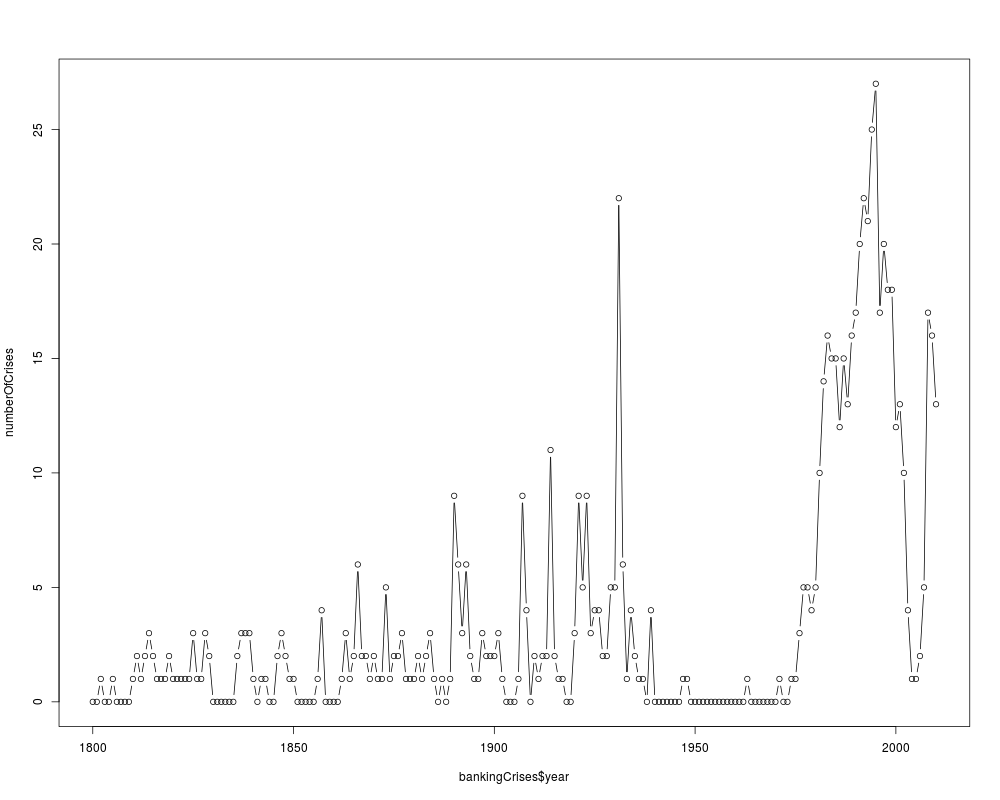
This is an update of a subset of the data used to create Figure 10.1. Capital Mobility and the Incidence of Banking Crises, All Countries, 1800-2008, Reinhart and Rogoff (2009, p. 156). The general upward trend visible in a plot of these data may be attributed to at least two different factors: (1) The gradual increase in the proportion of human labor that is monetized. (2) An increase in the general ability of cronies of those in power to gamble with other people's money in forming and bankrupting financial institutions. The marked feature of this plot is the virtual absence of banking crises during the period of the Bretton Woods agreement, 1944 to 1971. This period ended when US President Nixon in effect canceled the Bretton Woods agreement by taking the US off the silver standard. Author(s)Spencer Graves Sourcehttp://www.reinhartandrogoff.com ReferencesCarmen M. Reinhart and Kenneth S. Rogoff (2009) This Time Is Different: Eight Centuries of Financial Folly, Princeton U. Pr. See Also
Examples
data(bankingCrises)
numberOfCrises <- rowSums(bankingCrises[-1], na.rm=TRUE)
plot(bankingCrises$year, numberOfCrises, type='b')

# Write to a file for Wikimedia Commons
svg('bankingCrises.svg')
plot(bankingCrises$year, numberOfCrises, type='b', cex.axis=2,
     las=1, xlab='', ylab='', bty='n', cex=0.5)
abline(v=c(1945, 1971), lty='dashed', col='blue')
text(1958, 14, 'Bretton Woods', srt=90, cex=2, col='blue')
dev.off()
Results
R version 3.3.1 (2016-06-21) -- "Bug in Your Hair"
Copyright (C) 2016 The R Foundation for Statistical Computing
Platform: x86_64-pc-linux-gnu (64-bit)

R is free software and comes with ABSOLUTELY NO WARRANTY.
You are welcome to redistribute it under certain conditions.
Type 'license()' or 'licence()' for distribution details.

R is a collaborative project with many contributors.
Type 'contributors()' for more information and
'citation()' on how to cite R or R packages in publications.

Type 'demo()' for some demos, 'help()' for on-line help, or
'help.start()' for an HTML browser interface to help.
Type 'q()' to quit R.

> library(Ecdat)
Loading required package: Ecfun

Attaching package: 'Ecfun'

The following object is masked from 'package:base':

    sign


Attaching package: 'Ecdat'

The following object is masked from 'package:datasets':

    Orange

> png(filename="/home/ddbj/snapshot/RGM3/R_CC/result/Ecdat/bankingCrises.Rd_%03d_medium.png", width=480, height=480)
> ### Name: bankingCrises
> ### Title: Countries in Banking Crises
> ### Aliases: bankingCrises
> ### Keywords: datasets
>
> ### ** Examples
>
> data(bankingCrises)
> numberOfCrises <- rowSums(bankingCrises[-1], na.rm=TRUE)
> plot(bankingCrises$year, numberOfCrises, type='b')
>
> # Write to a file for Wikimedia Commons
> svg('bankingCrises.svg')
> plot(bankingCrises$year, numberOfCrises, type='b', cex.axis=2,
+      las=1, xlab='', ylab='', bty='n', cex=0.5)
> abline(v=c(1945, 1971), lty='dashed', col='blue')
> text(1958, 14, 'Bretton Woods', srt=90, cex=2, col='blue')
> dev.off()
png
  2
>
>
>
>
>
> dev.off()
null device
          1
>
|