Supported by Dr. Osamu Ogasawara and  . . |
|
Last data update: 2014.03.03 |
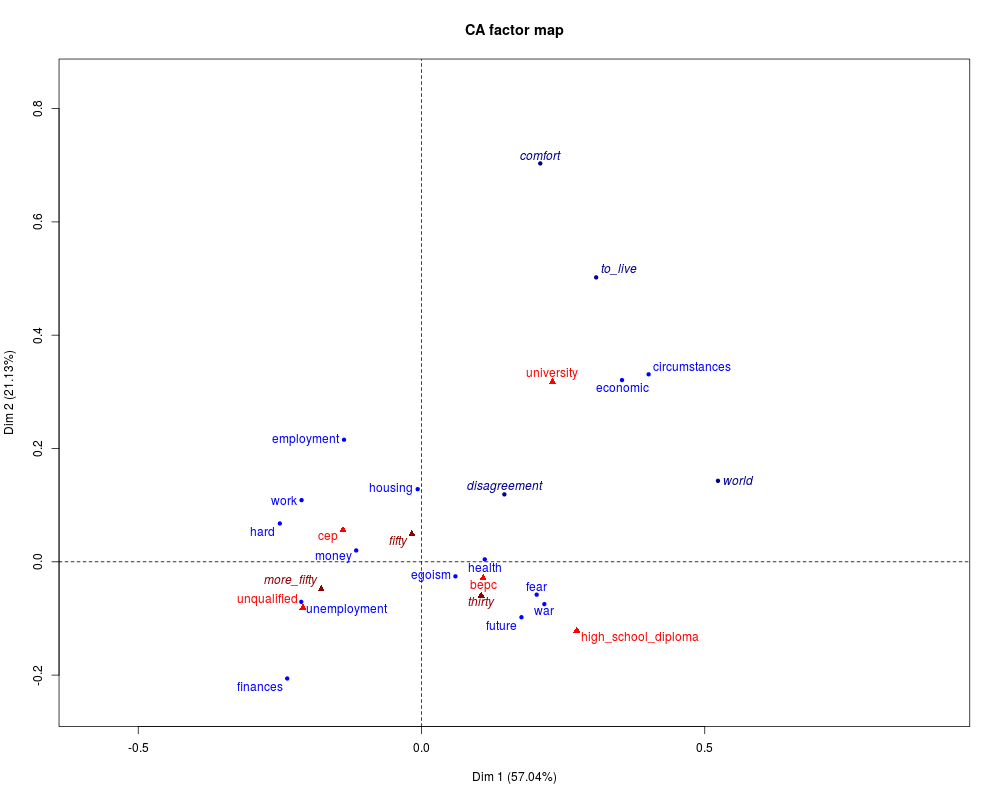
Children (data)DescriptionThe data used here is a contingency table that summarizes the answers given by different categories of people to the following question : according to you, what are the reasons that can make hesitate a woman or a couple to have children? Usagedata(children) FormatA data frame with 18 rows and 8 columns. Rows represent the different reasons mentioned, columns represent the different categories (education, age) people belong to. SourceTraitements Statistiques des Enqu<c3><aa>tes (D. Grang<c3><a9>, L. Lebart, eds.) Dunod, 1993 Examplesdata(children) res.ca <- CA (children, row.sup = 15:18, col.sup = 6:8) Results
R version 3.3.1 (2016-06-21) -- "Bug in Your Hair"
Copyright (C) 2016 The R Foundation for Statistical Computing
Platform: x86_64-pc-linux-gnu (64-bit)

R is free software and comes with ABSOLUTELY NO WARRANTY.
You are welcome to redistribute it under certain conditions.
Type 'license()' or 'licence()' for distribution details.

R is a collaborative project with many contributors.
Type 'contributors()' for more information and
'citation()' on how to cite R or R packages in publications.

Type 'demo()' for some demos, 'help()' for on-line help, or
'help.start()' for an HTML browser interface to help.
Type 'q()' to quit R.

> library(FactoMineR)
> png(filename="/home/ddbj/snapshot/RGM3/R_CC/result/FactoMineR/children.Rd_%03d_medium.png", width=480, height=480)
> ### Name: children
> ### Title: Children (data)
> ### Aliases: children
> ### Keywords: datasets
>
> ### ** Examples
>
> data(children)
> res.ca <- CA (children, row.sup = 15:18, col.sup = 6:8)
>
>
>
>
>
> dev.off()
null device
          1
>
|
Created & Maintained by Osamu Ogasawara (osamu.ogasawara@gmail.com) and 