Supported by Dr. Osamu Ogasawara and  . . |
|
Last data update: 2014.03.03 |
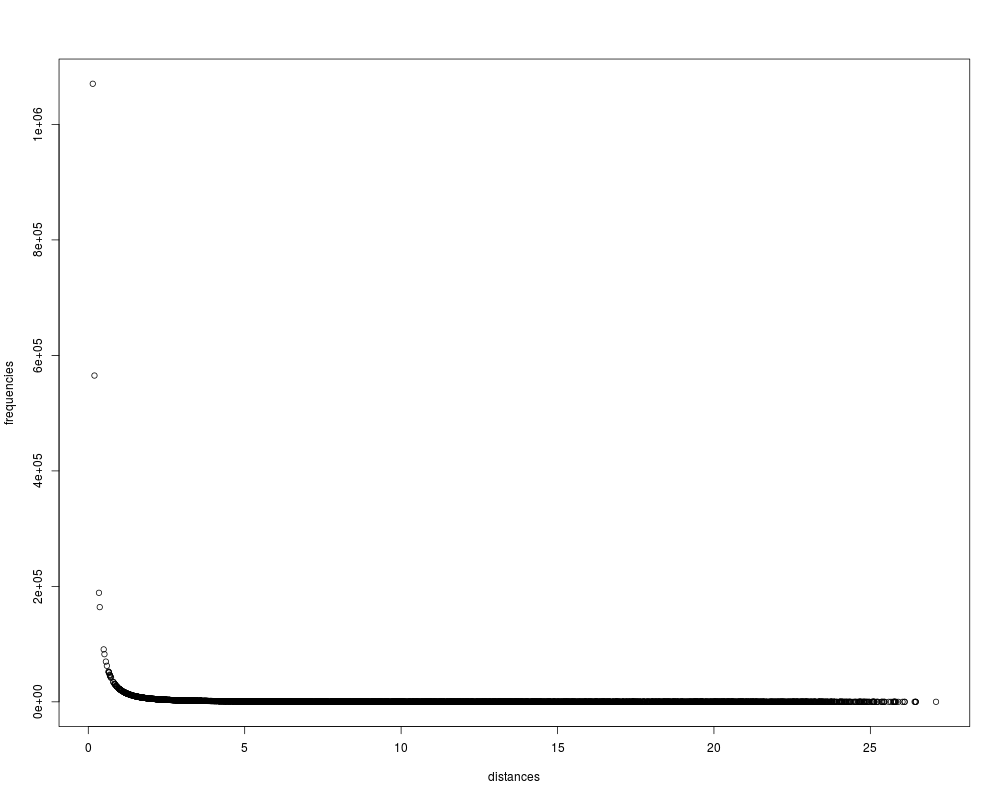
in-silico FISH distances and matching Hi-C frequencies with 5% noiseDescriptionin-silico distances were computed from the random configuration Usagedata(match) FormatA data frame with 4950 observations on the following 2 variables.
.
. ReferencesY. Shavit, F.K. Hamey, P. Lio', FisHiCal: an R package for iterative FISH-based calibration of Hi-C data, 2014 (submitted). Examplesdata(match) plot(match$frequencies ~ match$distances, xlab = "distances", ylab = "frequencies") Results
R version 3.3.1 (2016-06-21) -- "Bug in Your Hair"
Copyright (C) 2016 The R Foundation for Statistical Computing
Platform: x86_64-pc-linux-gnu (64-bit)

R is free software and comes with ABSOLUTELY NO WARRANTY.
You are welcome to redistribute it under certain conditions.
Type 'license()' or 'licence()' for distribution details.

R is a collaborative project with many contributors.
Type 'contributors()' for more information and
'citation()' on how to cite R or R packages in publications.

Type 'demo()' for some demos, 'help()' for on-line help, or
'help.start()' for an HTML browser interface to help.
Type 'q()' to quit R.

> library(FisHiCal)
Loading required package: igraph

Attaching package: 'igraph'

The following objects are masked from 'package:stats':

    decompose, spectrum

The following object is masked from 'package:base':

    union

Loading required package: RcppArmadillo
> png(filename="/home/ddbj/snapshot/RGM3/R_CC/result/FisHiCal/match.Rd_%03d_medium.png", width=480, height=480)
> ### Name: match
> ### Title: in-silico FISH distances and matching Hi-C frequencies with 5%
> ###   noise
> ### Aliases: match
> ### Keywords: datasets datasets
>
> ### ** Examples
>
> data(match)
> plot(match$frequencies ~ match$distances, xlab = "distances", ylab = "frequencies")
>
>
>
>
>
> dev.off()
null device
          1
>
|
Created & Maintained by Osamu Ogasawara (osamu.ogasawara@gmail.com) and 