Supported by Dr. Osamu Ogasawara and  . . |
|
Last data update: 2014.03.03 |
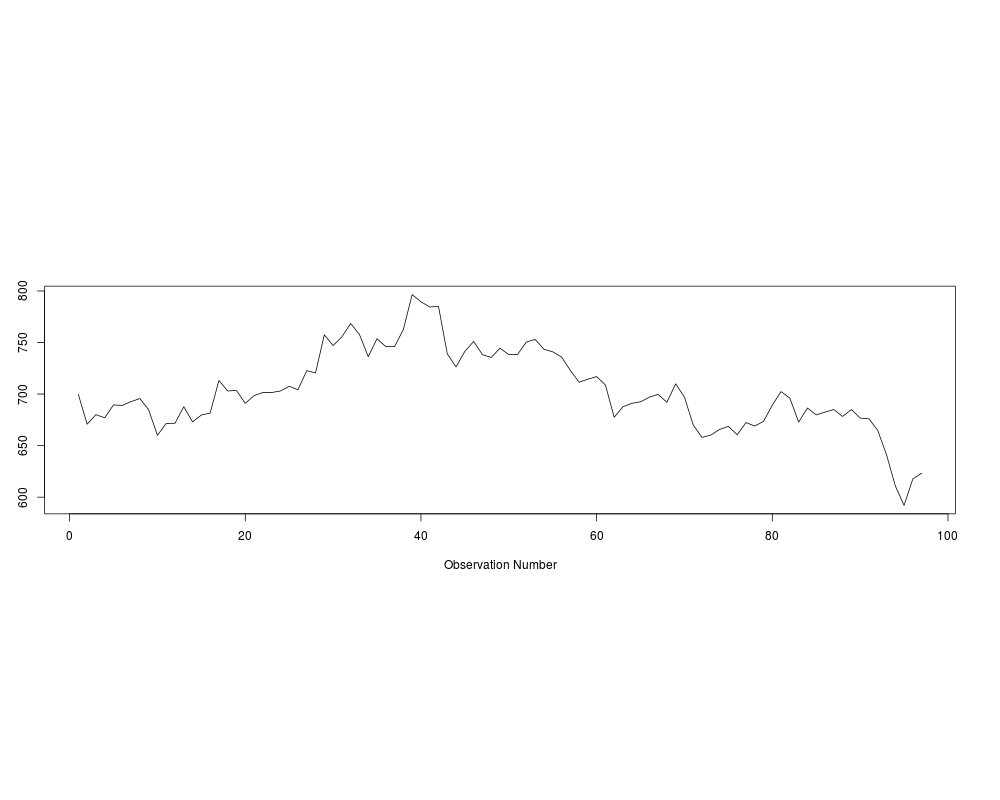
Commodity pricesDescriptionCommodity prices on successive business days, Chicago Exchange These data exhibit classic randow walk behavior. Usagedata(Commodities) FormatThe format is: List of 5 $ gold:'data.frame': 97 obs. of 3 variables: ..$ close: num [1:97] 700 671 680 677 690 ... ..$ high : num [1:97] 714 698 683 682 692 ... ..$ low : num [1:97] 700 669 664 676 684 ... $ feed:'data.frame': 95 obs. of 3 variables: ..$ close: num [1:95] 79 79 78.6 79.9 79.3 ... ..$ high : num [1:95] 80 79.5 79.2 79.9 79.8 ... ..$ low : num [1:95] 79 78.5 78.6 78.8 79.3 ... $ port:'data.frame': 99 obs. of 3 variables: ..$ close: num [1:99] 57.7 56.8 57.5 57 59 ... ..$ high : num [1:99] 59.9 57.5 58 58.1 59 ... ..$ low : num [1:99] 57.2 56.4 55.1 56.8 56.4 ... $ soy :'data.frame': 99 obs. of 3 variables: ..$ close: num [1:99] 766 790 804 794 824 ... ..$ high : num [1:99] 788 791 805 808 824 ... ..$ low : num [1:99] 764 764 778 792 809 ... $ us :'data.frame': 100 obs. of 3 variables: ..$ close: num [1:100] 91.6 91.6 91.4 91.4 91.2 ... ..$ high : num [1:100] 91.9 91.7 91.6 91.4 91.5 ... ..$ low : num [1:100] 91.6 91.5 91.3 91.3 91.1 ... DetailsData from 1981. feed: April; gold: June, pork: March, us: March SourceI obtained these data from a broker. Examplesdim(Commodities$gold) dimnames(Commodities$gold)[[2]] TimeSeriesPlot(Commodities$gold$close) Results
R version 3.3.1 (2016-06-21) -- "Bug in Your Hair"
Copyright (C) 2016 The R Foundation for Statistical Computing
Platform: x86_64-pc-linux-gnu (64-bit)

R is free software and comes with ABSOLUTELY NO WARRANTY.
You are welcome to redistribute it under certain conditions.
Type 'license()' or 'licence()' for distribution details.

R is a collaborative project with many contributors.
Type 'contributors()' for more information and
'citation()' on how to cite R or R packages in publications.

Type 'demo()' for some demos, 'help()' for on-line help, or
'help.start()' for an HTML browser interface to help.
Type 'q()' to quit R.

> library(FitAR)
Loading required package: lattice
Loading required package: leaps
Loading required package: ltsa
Loading required package: bestglm
> png(filename="/home/ddbj/snapshot/RGM3/R_CC/result/FitAR/Commodities.Rd_%03d_medium.png", width=480, height=480)
> ### Name: Commodities
> ### Title: Commodity prices
> ### Aliases: Commodities
> ### Keywords: datasets
>
> ### ** Examples
>
> dim(Commodities$gold)
[1] 97  3
> dimnames(Commodities$gold)[[2]]
[1] "close" "high"  "low"
> TimeSeriesPlot(Commodities$gold$close)
>
>
>
>
>
> dev.off()
null device
          1
>
|