Supported by Dr. Osamu Ogasawara and  . . |
|
Last data update: 2014.03.03 |
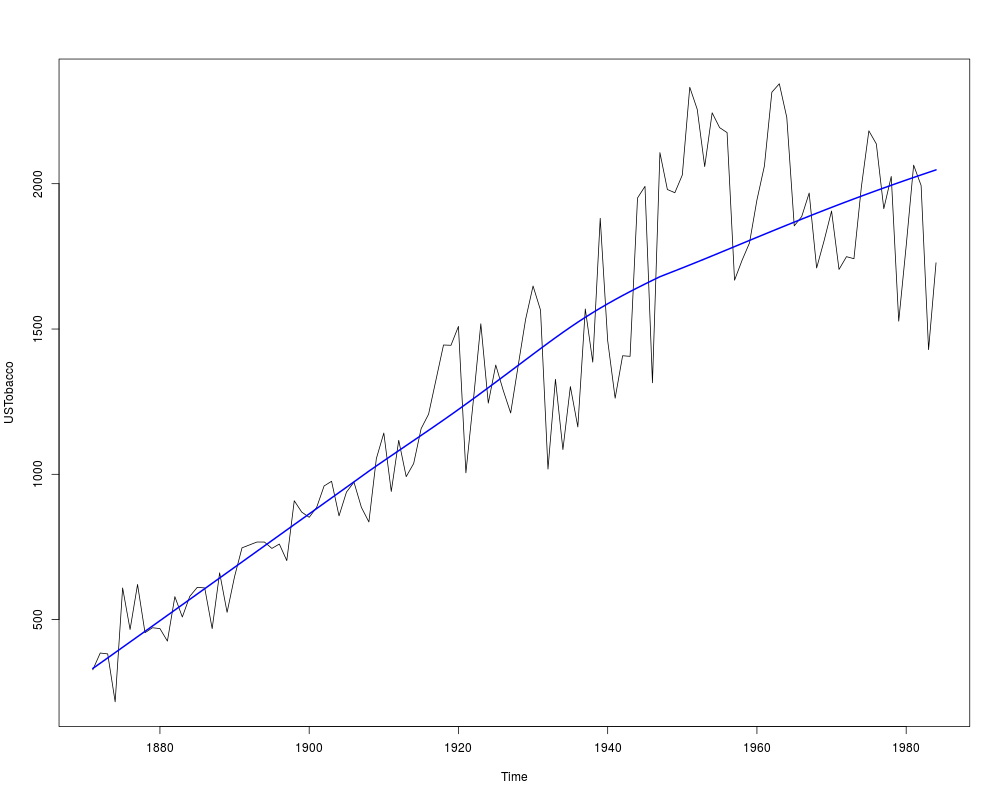
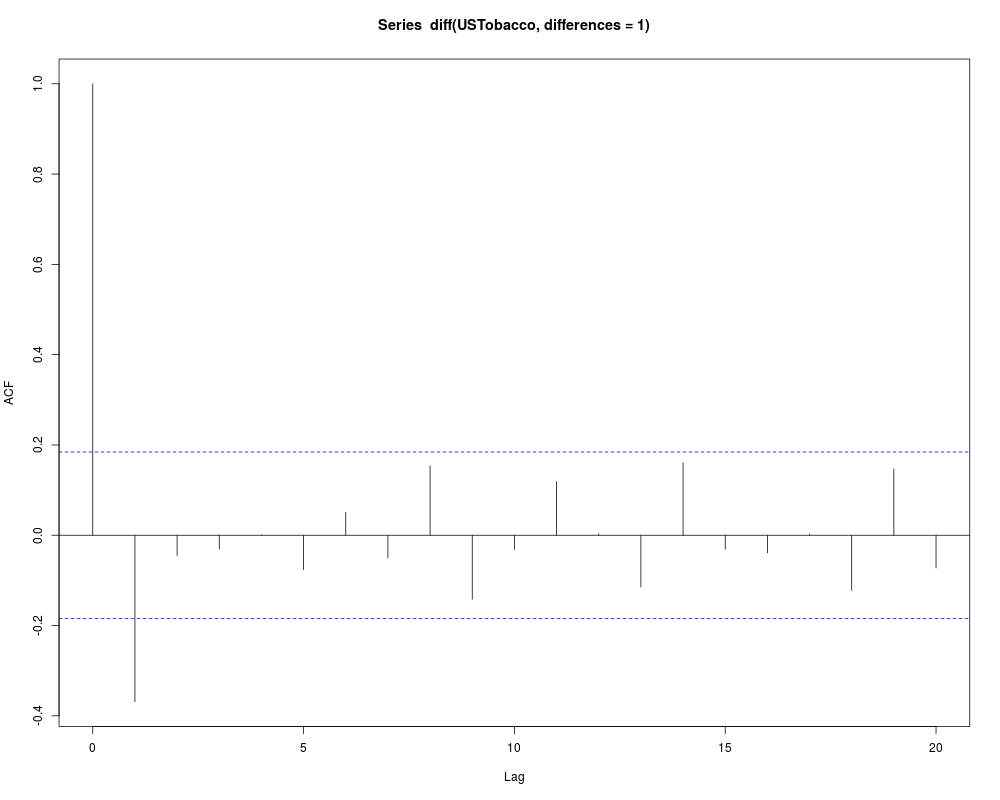
U.S. Tobacco Production, 1871-1984DescriptionAnnual U.S. tobacco production, 1871-1984, in millions of pounds. Usagedata(USTobacco) FormatThe format is: Time-Series [1:114] from 1871 to 1984: 327 385 382 217 609 466 621 455 472 469 ... - attr(*, "title")= chr "Tobacco production,US, 1871-1984" DetailsWei (2006, p.120, Example 6.6) fits an ARIMA(0,1,1) to the logarithms. But a more accurate Box-Cox analysis indicates a square-root transformation should be used. A more complex ARIMA-GARCH model is also suggested by Wei (2006). SourceWei, W.W.S. (2006, Series W6, p.570), Time Series Analysis: Univariate and Multivariate Methods. 2nd Ed., New York: Addison-Wesley. Examples#From a plot of the series, we see that the variance is increasing with level. #From the acf of the first differences an ARIMA(0,1,1) is suggested. data(USTobacco) # layout(matrix(c(1,2,1,2),ncol=2)) plot(USTobacco) lines(lowess(time(USTobacco), USTobacco), lwd=2, col="blue") acf(diff(USTobacco, differences=1)) Results
R version 3.3.1 (2016-06-21) -- "Bug in Your Hair"
Copyright (C) 2016 The R Foundation for Statistical Computing
Platform: x86_64-pc-linux-gnu (64-bit)

R is free software and comes with ABSOLUTELY NO WARRANTY.
You are welcome to redistribute it under certain conditions.
Type 'license()' or 'licence()' for distribution details.

R is a collaborative project with many contributors.
Type 'contributors()' for more information and
'citation()' on how to cite R or R packages in publications.

Type 'demo()' for some demos, 'help()' for on-line help, or
'help.start()' for an HTML browser interface to help.
Type 'q()' to quit R.

> library(FitAR)
Loading required package: lattice
Loading required package: leaps
Loading required package: ltsa
Loading required package: bestglm
> png(filename="/home/ddbj/snapshot/RGM3/R_CC/result/FitAR/USTobacco.Rd_%03d_medium.png", width=480, height=480)
> ### Name: USTobacco
> ### Title: U.S. Tobacco Production, 1871-1984
> ### Aliases: USTobacco
> ### Keywords: datasets
>
> ### ** Examples
>
> #From a plot of the series, we see that the variance is increasing with level.
> #From the acf of the first differences an ARIMA(0,1,1) is suggested.
>  data(USTobacco)
> # layout(matrix(c(1,2,1,2),ncol=2))
>  plot(USTobacco)
>  lines(lowess(time(USTobacco), USTobacco), lwd=2, col="blue")
>  acf(diff(USTobacco, differences=1))
>
>
>
>
>
>
> dev.off()
null device
          1
>
|
Created & Maintained by Osamu Ogasawara (osamu.ogasawara@gmail.com) and 