Supported by Dr. Osamu Ogasawara and  . . |
|
Last data update: 2014.03.03 |
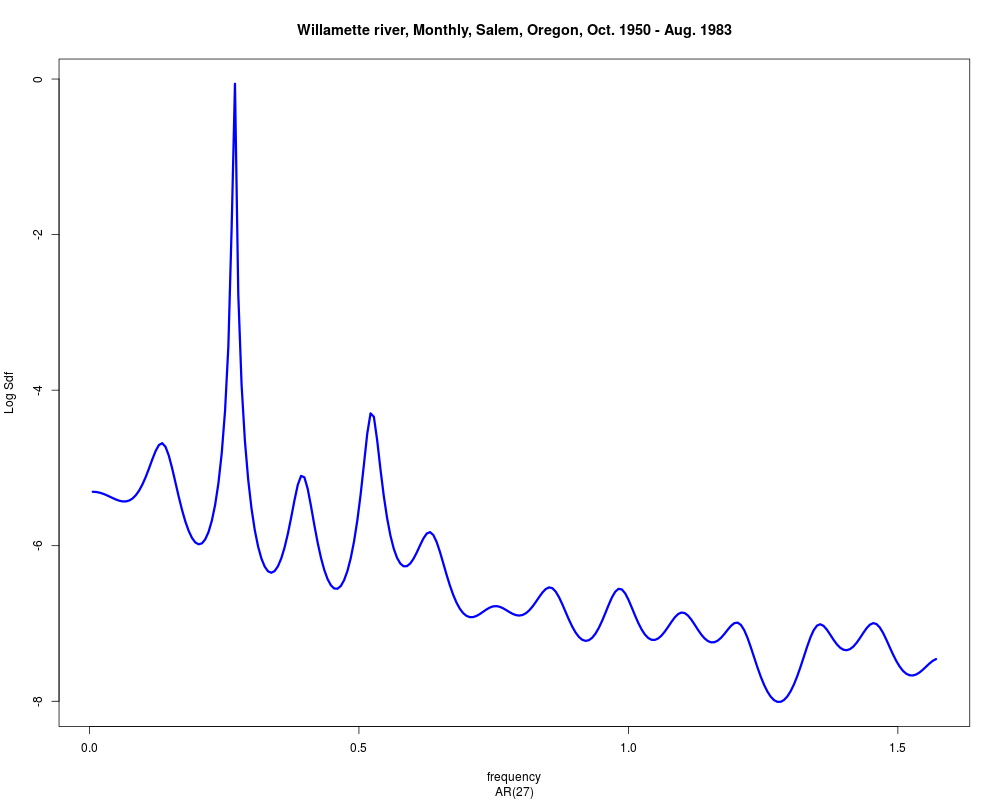
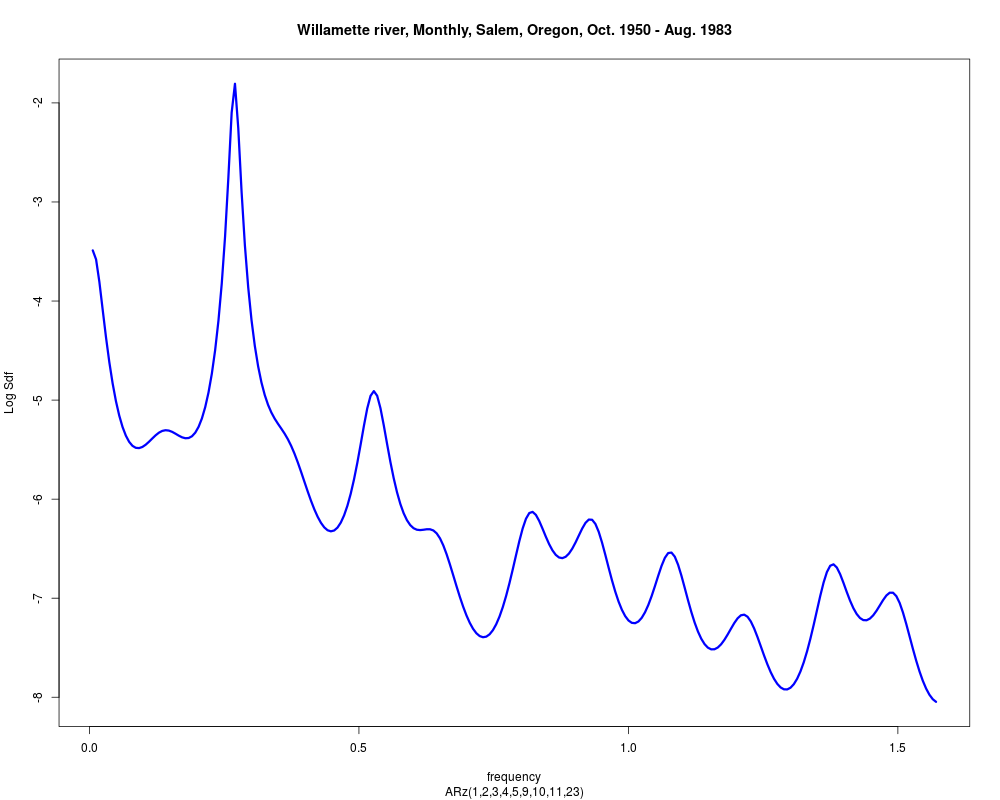
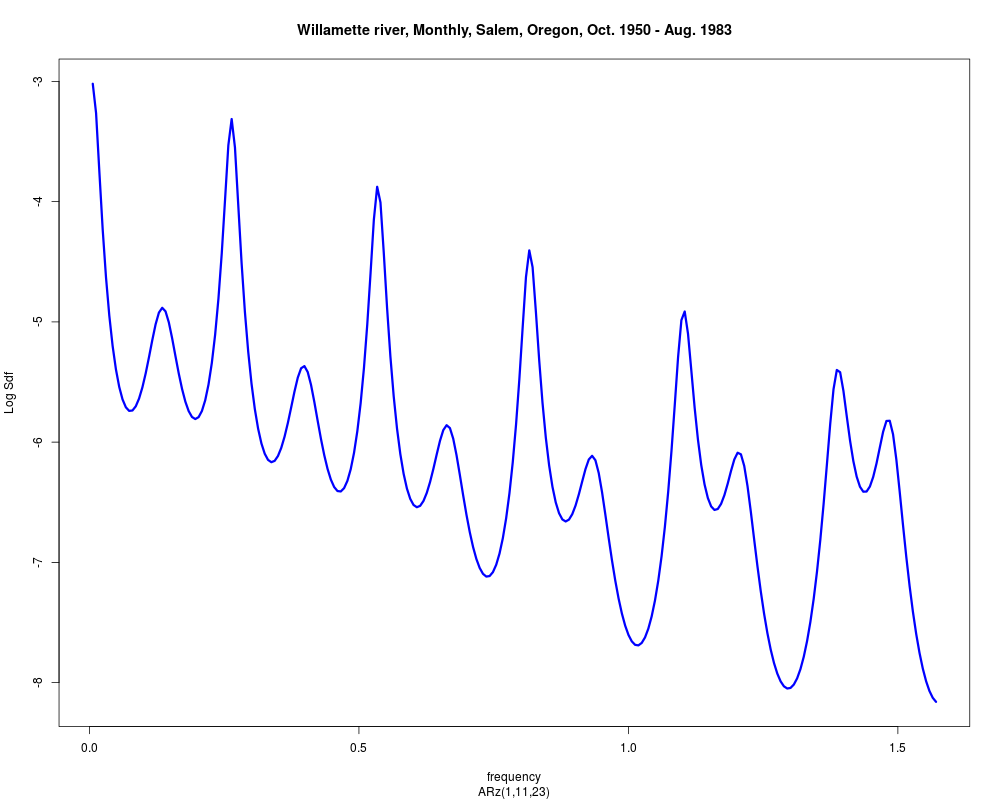
Willamette Riverflow Time SeriesDescriptionMonthly flows of the Willamette River, Salem, Oregon, Oct. 1950 - Aug. 1983. Percival and Walden (1993, Ch. 10.15) fit high-order AR models to estimate the spectral density function. Usagedata(Willamette) FormatThe format is: Time-Series [1:395] from 1951 to 1984: 8.95 9.49 10.19 10.96 11.08 ... - attr(*, "title")= chr "Willamette river, Monthly, Salem, Oregon, Oct. 1950 - Aug. 1983" Sourcehttp://faculty.washington.edu/dbp/sapabook.html ReferencesPercival, D.B. and Walden, A.T. (1993), Spectral Analysis for Physical Applications. Cambridge University Press. Examples#Percival and Walden (1993) fit an AR(27). #Compare spectral densities with subset AR's. data(Willamette) pmax<-27 sdfplot(FitAR(log(Willamette), pmax)) p<-SelectModel(log(Willamette), ARModel="ARz", lag.max=pmax, Best=1) sdfplot(FitAR(log(Willamette), p)) p<-SelectModel(log(Willamette), ARModel="ARp", lag.max=pmax, Best=1) sdfplot(FitAR(log(Willamette), p), ARModel="ARp", MLEQ=FALSE) Results
R version 3.3.1 (2016-06-21) -- "Bug in Your Hair"
Copyright (C) 2016 The R Foundation for Statistical Computing
Platform: x86_64-pc-linux-gnu (64-bit)

R is free software and comes with ABSOLUTELY NO WARRANTY.
You are welcome to redistribute it under certain conditions.
Type 'license()' or 'licence()' for distribution details.

R is a collaborative project with many contributors.
Type 'contributors()' for more information and
'citation()' on how to cite R or R packages in publications.

Type 'demo()' for some demos, 'help()' for on-line help, or
'help.start()' for an HTML browser interface to help.
Type 'q()' to quit R.

> library(FitAR)
Loading required package: lattice
Loading required package: leaps
Loading required package: ltsa
Loading required package: bestglm
> png(filename="/home/ddbj/snapshot/RGM3/R_CC/result/FitAR/Willamette.Rd_%03d_medium.png", width=480, height=480)
> ### Name: Willamette
> ### Title: Willamette Riverflow Time Series
> ### Aliases: Willamette
> ### Keywords: datasets
>
> ### ** Examples
>
> #Percival and Walden (1993) fit an AR(27).
> #Compare spectral densities with subset AR's.
> data(Willamette)
> pmax<-27
> sdfplot(FitAR(log(Willamette), pmax))
> p<-SelectModel(log(Willamette), ARModel="ARz", lag.max=pmax, Best=1)
> sdfplot(FitAR(log(Willamette), p))
> p<-SelectModel(log(Willamette), ARModel="ARp", lag.max=pmax, Best=1)
> sdfplot(FitAR(log(Willamette), p), ARModel="ARp", MLEQ=FALSE)
There were 12 warnings (use warnings() to see them)
>
>
>
>
>
> dev.off()
null device
          1
>
|
Created & Maintained by Osamu Ogasawara (osamu.ogasawara@gmail.com) and 