Supported by Dr. Osamu Ogasawara and  . . |
|
Last data update: 2014.03.03 |
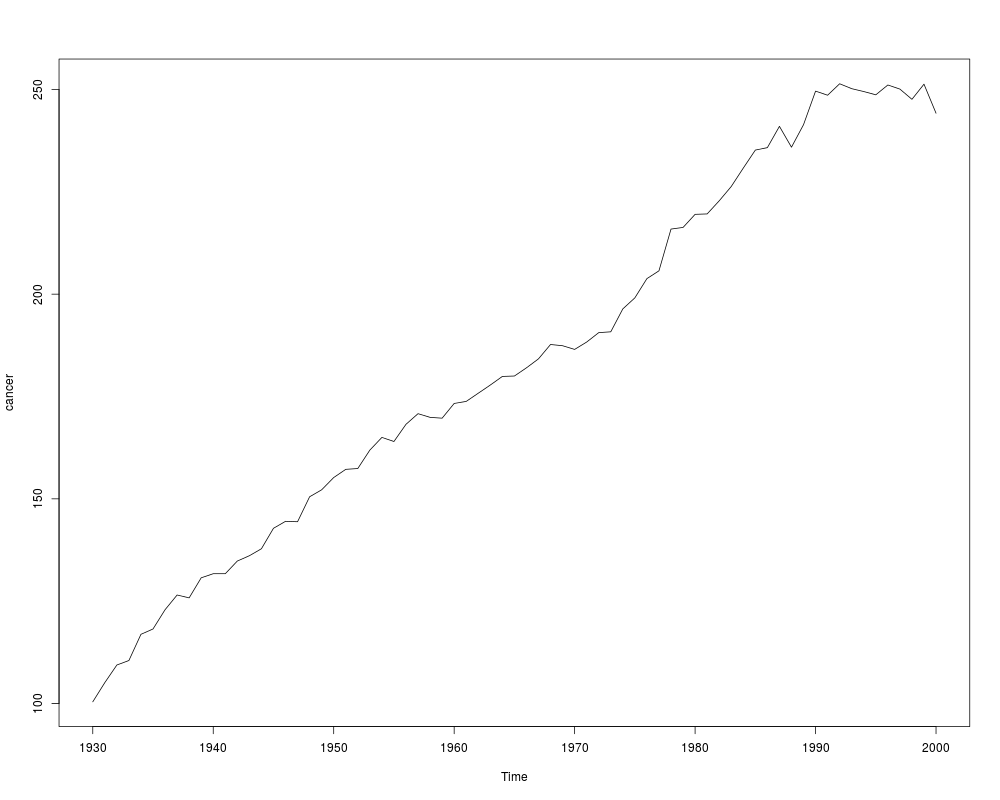
Cancer DataDescriptionYearly cancer death rate (per 100,000 population) of Pennsylvania between 1930 and 2000. Usagedata(cancer) FormatA time series with 71 observations on the following variable.
ReferencesWei, W. W.S. (2006). Time Series Analysis: Univariate and Multivariate Methods (2nd ed.) Boston: Addison-Wesley. Examplesdata(cancer) plot(cancer) out = fcast(cancer, f.number = 2) out$mean Results
R version 3.3.1 (2016-06-21) -- "Bug in Your Hair"
Copyright (C) 2016 The R Foundation for Statistical Computing
Platform: x86_64-pc-linux-gnu (64-bit)

R is free software and comes with ABSOLUTELY NO WARRANTY.
You are welcome to redistribute it under certain conditions.
Type 'license()' or 'licence()' for distribution details.

R is a collaborative project with many contributors.
Type 'contributors()' for more information and
'citation()' on how to cite R or R packages in publications.

Type 'demo()' for some demos, 'help()' for on-line help, or
'help.start()' for an HTML browser interface to help.
Type 'q()' to quit R.

> library(GMDH)
> png(filename="/home/ddbj/snapshot/RGM3/R_CC/result/GMDH/cancer.Rd_%03d_medium.png", width=480, height=480)
> ### Name: cancer
> ### Title: Cancer Data
> ### Aliases: cancer
> ### Keywords: datasets
>
> ### ** Examples
>
> data(cancer)
> plot(cancer)
> out = fcast(cancer, f.number = 2)
     Point Forecast    Lo 95    Hi 95
2001       246.9510 238.4714 255.4306
2002       246.9939 236.7607 257.2271
> out$mean
Time Series:
Start = 2001
End = 2002
Frequency = 1
[1] 246.9510 246.9939
>
>
>
>
>
> dev.off()
null device
          1
>
|
Created & Maintained by Osamu Ogasawara (osamu.ogasawara@gmail.com) and 