Supported by Dr. Osamu Ogasawara and  . . |
|
Last data update: 2014.03.03 |
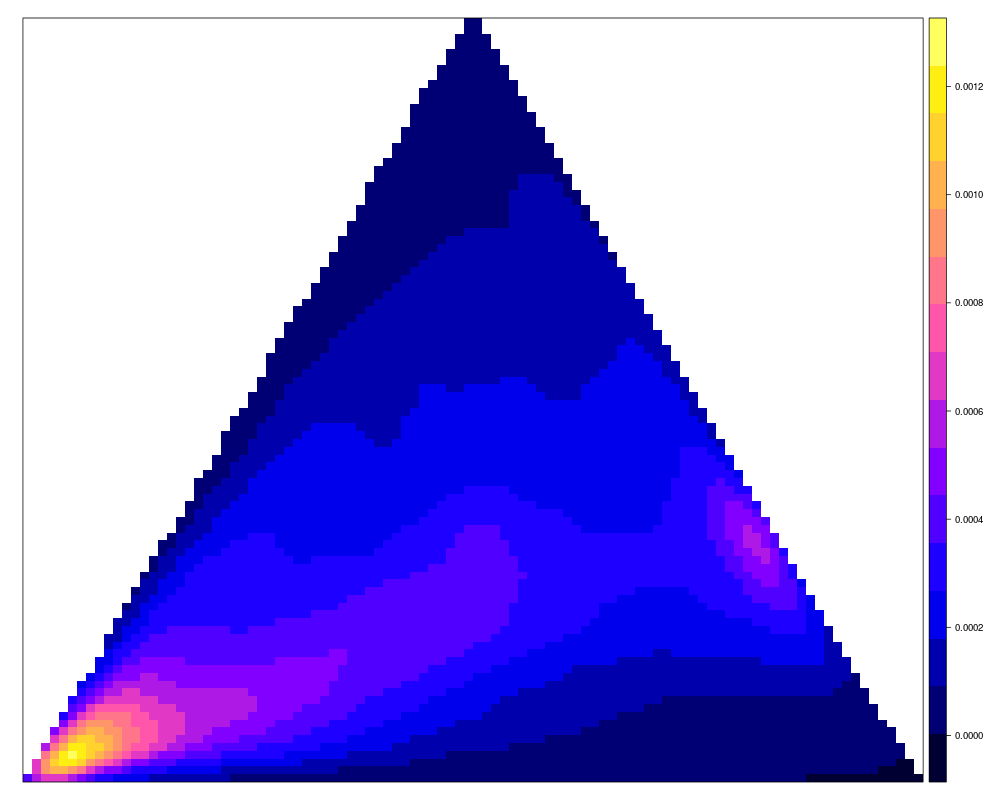
Probability density for texture triangleDescriptionProbability density for texture triangle (USDA system) based on global soil profile data (see ISRIC WoSIS). Usagedata(USDA.TT.im) FormatThe
NoteTexture by hand class can be converted to sand, silt, clay content fractions by using the Author(s)Tomislav Hengl References
See Also
Examples
## plot prior probabilities:
library(sp)
data(USDA.TT.im)
gridded(USDA.TT.im) <- ~s1+s2
spplot(USDA.TT.im["v"])

## Not run: library(soiltexture)
## convert textures by hand to sand, silt and clay:
TEXMHT <- c("CL","C","SiL","SiL","missing")
x <- TT2tri(TEXMHT)
x

## End(Not run)
Results
R version 3.3.1 (2016-06-21) -- "Bug in Your Hair"
Copyright (C) 2016 The R Foundation for Statistical Computing
Platform: x86_64-pc-linux-gnu (64-bit)

R is free software and comes with ABSOLUTELY NO WARRANTY.
You are welcome to redistribute it under certain conditions.
Type 'license()' or 'licence()' for distribution details.

R is a collaborative project with many contributors.
Type 'contributors()' for more information and
'citation()' on how to cite R or R packages in publications.

Type 'demo()' for some demos, 'help()' for on-line help, or
'help.start()' for an HTML browser interface to help.
Type 'q()' to quit R.

> library(GSIF)
GSIF version 0.5-2 (2016-06-25)
URL: http://gsif.r-forge.r-project.org/
> png(filename="/home/ddbj/snapshot/RGM3/R_CC/result/GSIF/USDA.TT.im.Rd_%03d_medium.png", width=480, height=480)
> ### Name: USDA.TT.im
> ### Title: Probability density for texture triangle
> ### Aliases: USDA.TT.im TT2tri
> ### Keywords: datasets
>
> ### ** Examples
>
> ## plot prior probabilities:
> library(sp)
> data(USDA.TT.im)
> gridded(USDA.TT.im) <- ~s1+s2
> spplot(USDA.TT.im["v"])
>
> ## Not run:
> ##D library(soiltexture)
> ##D ## convert textures by hand to sand, silt and clay:
> ##D TEXMHT <- c("CL","C","SiL","SiL","missing")
> ##D x <- TT2tri(TEXMHT)
> ##D x
> ## End(Not run)
>
>
>
>
>
> dev.off()
null device
          1
>
|