Supported by Dr. Osamu Ogasawara and  . . |
|
Last data update: 2014.03.03 |
Galton's data on the heights of parents and their children, by childDescriptionThis data set lists the individual observations for 934 children in 205 families on which Galton (1886) based his cross-tabulation. In addition to the question of the relation between heights of parents and their offspring, for which this data is mainly famous, Galton had another purpose which the data in this form allows to address: Does marriage selection indicate a relationship between the heights of husbands and wives, a topic he called assortative mating? Keen [p. 297-298](2010) provides a brief discussion of this topic. Usagedata(GaltonFamilies) FormatA data frame with 934 observations on the following 8 variables.
DetailsGalton's notebook lists 963 children in 205 families ranging from 1-15 adult children children. Of these, 29 had non-numeric heights recorded and are not included here. Families are largely listed in decending order of fathers and mothers height. SourceGalton's notebook, http://www.medicine.mcgill.ca/epidemiology/hanley/galton/notebook/, transcribed by Beverley Shipley in 2001. ReferencesGalton, F. (1886). Regression Towards Mediocrity in Hereditary Stature Journal of the Anthropological Institute, 15, 246-263 Hanley, J. A. (2004). "Transmuting" Women into Men: Galton's Family Data on Human Stature. The American Statistician, 58, 237-243. See: http://www.medicine.mcgill.ca/epidemiology/hanley/galton/ for source materials. Keen, K. J. (2010). Graphics for Statistics and Data Analysis with R, Boca Raton: CRC Press, http://www.unbc.ca/keen/graphics-for-statistics-and-data-analysis-with-r. See Also
Examples
data(GaltonFamilies)
str(GaltonFamilies)
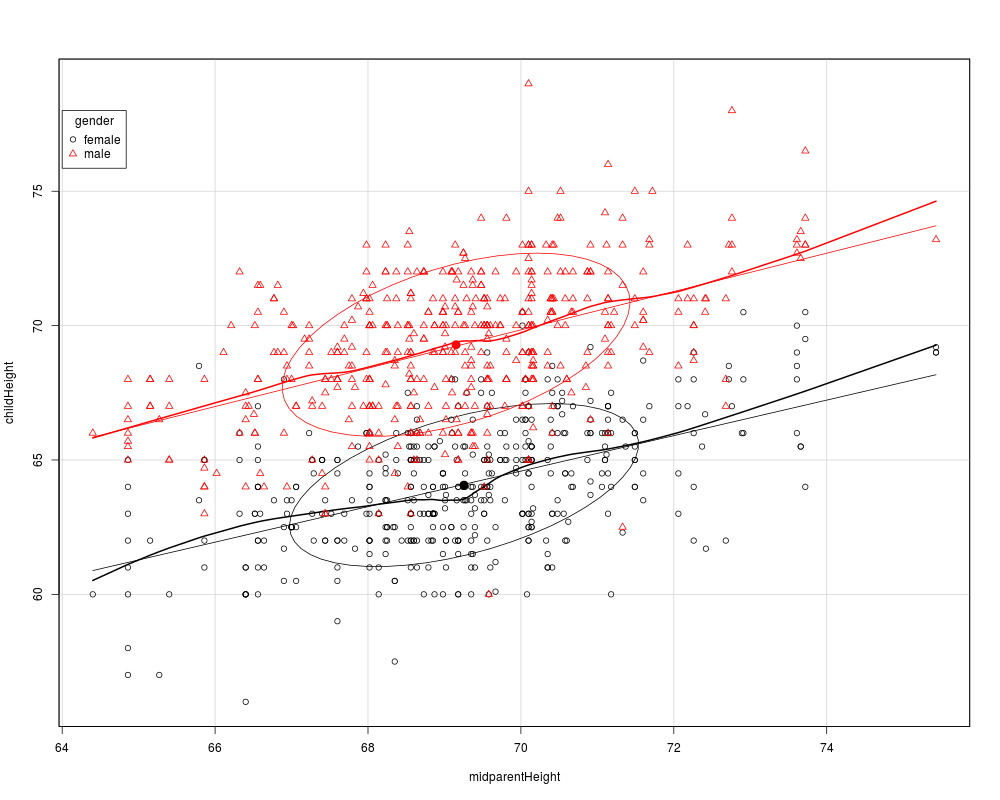
## reproduce Fig 2 in Hanley (2004)
library(car)
scatterplot(childHeight ~ midparentHeight | gender, data=GaltonFamilies,
ellipse=TRUE, levels=0.68, legend.coords=list(x=64, y=78))
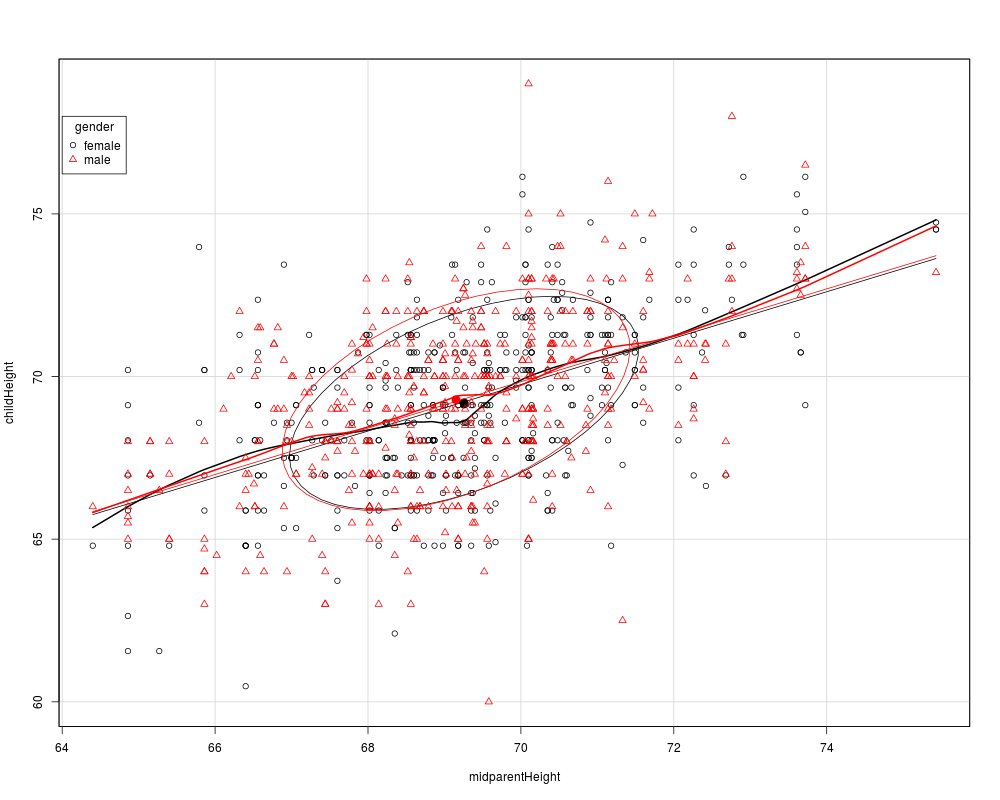
# multiply daughters' heights by 1.08
GF1 <- within(GaltonFamilies,
{childHeight <- ifelse (gender=="female", 1.08*childHeight, childHeight)} )
scatterplot(childHeight ~ midparentHeight | gender, data=GF1,
ellipse=TRUE, levels=0.68, legend.coords=list(x=64, y=78))
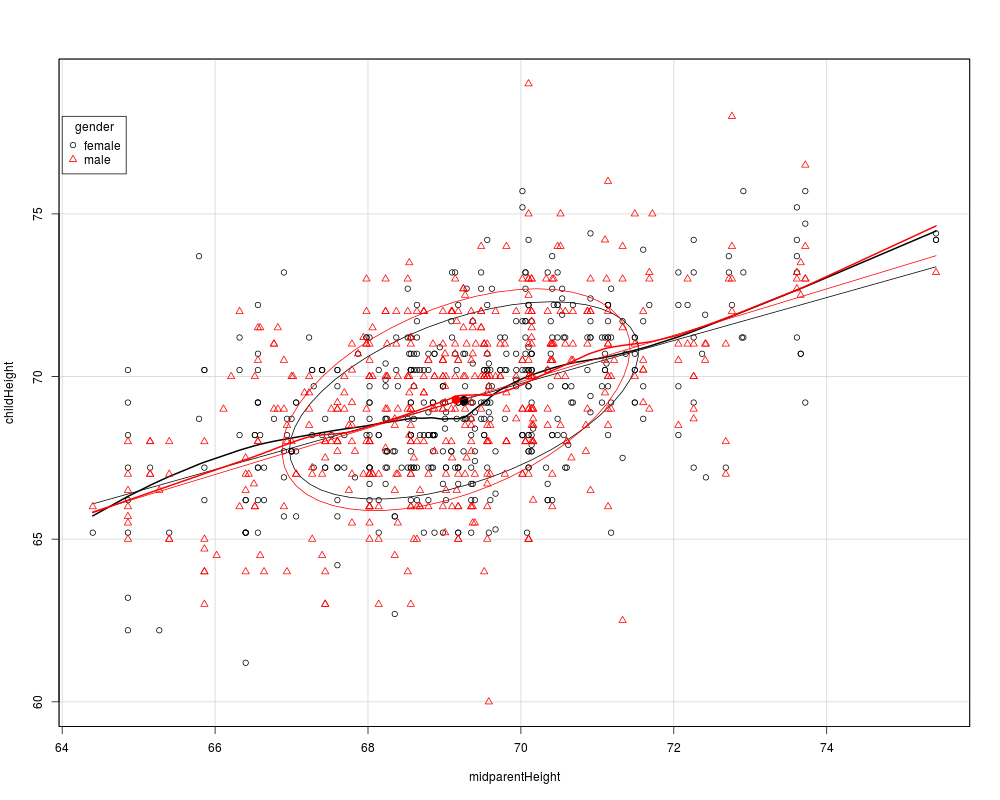
# add 5.2 to daughters' heights
GF2 <- within(GaltonFamilies,
{childHeight <- ifelse (gender=="female", childHeight+5.2, childHeight)} )
scatterplot(childHeight ~ midparentHeight | gender, data=GF2,
ellipse=TRUE, levels=0.68, legend.coords=list(x=64, y=78))
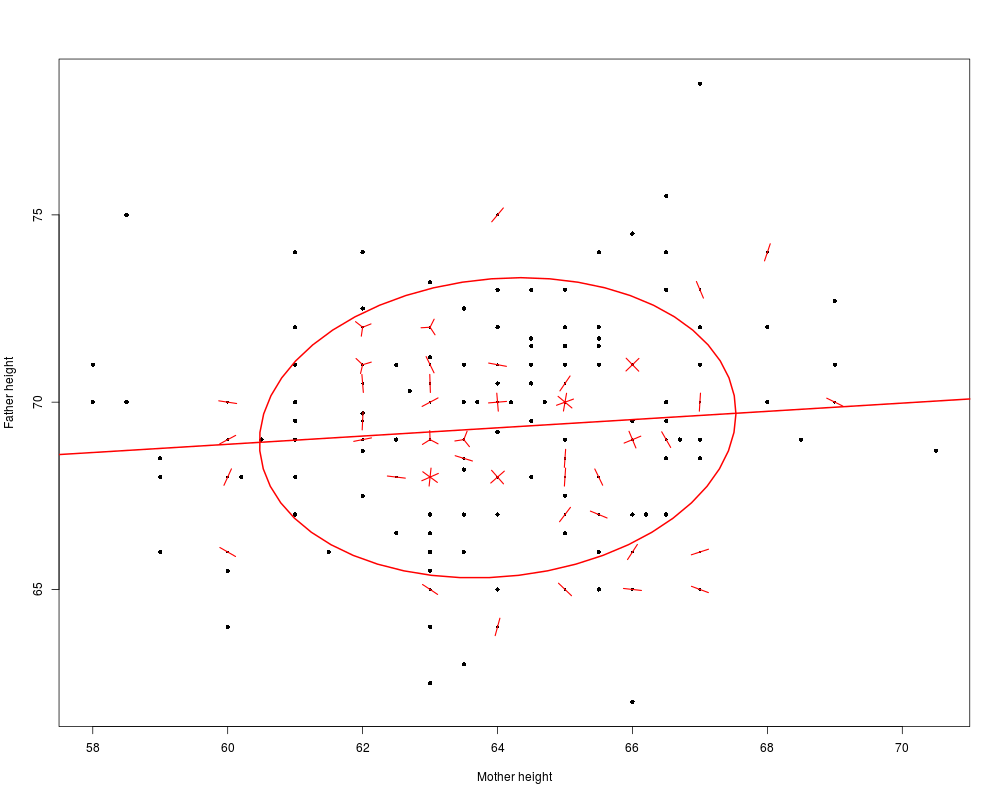
#########################################
# relationship between heights of parents
#########################################
Parents <- subset(GaltonFamilies, !duplicated(GaltonFamilies$family))
with(Parents, {
sunflowerplot(mother, father, rotate=TRUE, pch=16,
xlab="Mother height", ylab="Father height")
dataEllipse(mother, father, add=TRUE, plot.points=FALSE,
center.pch=NULL, levels=0.68)
abline(lm(father ~ mother), col="red", lwd=2)
}
)
Results
R version 3.3.1 (2016-06-21) -- "Bug in Your Hair"
Copyright (C) 2016 The R Foundation for Statistical Computing
Platform: x86_64-pc-linux-gnu (64-bit)

R is free software and comes with ABSOLUTELY NO WARRANTY.
You are welcome to redistribute it under certain conditions.
Type 'license()' or 'licence()' for distribution details.

R is a collaborative project with many contributors.
Type 'contributors()' for more information and
'citation()' on how to cite R or R packages in publications.

Type 'demo()' for some demos, 'help()' for on-line help, or
'help.start()' for an HTML browser interface to help.
Type 'q()' to quit R.

> library(HistData)
> png(filename="/home/ddbj/snapshot/RGM3/R_CC/result/HistData/GaltonFamilies.Rd_%03d_medium.png", width=480, height=480)
> ### Name: GaltonFamilies
> ### Title: Galton's data on the heights of parents and their children, by
> ###   child
> ### Aliases: GaltonFamilies
> ### Keywords: datasets
>
> ### ** Examples
>
> data(GaltonFamilies)
> str(GaltonFamilies)
'data.frame':	934 obs. of  8 variables:
 $ family         : Factor w/ 205 levels "001","002","003",..: 1 1 1 1 2 2 2 2 3 3 ...
 $ father         : num  78.5 78.5 78.5 78.5 75.5 75.5 75.5 75.5 75 75 ...
 $ mother         : num  67 67 67 67 66.5 66.5 66.5 66.5 64 64 ...
 $ midparentHeight: num  75.4 75.4 75.4 75.4 73.7 ...
 $ children       : int  4 4 4 4 4 4 4 4 2 2 ...
 $ childNum       : int  1 2 3 4 1 2 3 4 1 2 ...
 $ gender         : Factor w/ 2 levels "female","male": 2 1 1 1 2 2 1 1 2 1 ...
 $ childHeight    : num  73.2 69.2 69 69 73.5 72.5 65.5 65.5 71 68 ...
>
> ## reproduce Fig 2 in Hanley (2004)
> library(car)
> scatterplot(childHeight ~ midparentHeight | gender, data=GaltonFamilies,
+     ellipse=TRUE, levels=0.68, legend.coords=list(x=64, y=78))
>
> # multiply daughters' heights by 1.08
> GF1 <- within(GaltonFamilies,
+               {childHeight <- ifelse (gender=="female", 1.08*childHeight, childHeight)} )
> scatterplot(childHeight ~ midparentHeight | gender, data=GF1,
+     ellipse=TRUE, levels=0.68, legend.coords=list(x=64, y=78))
>
> # add 5.2 to daughters' heights
> GF2 <- within(GaltonFamilies,
+               {childHeight <- ifelse (gender=="female", childHeight+5.2, childHeight)} )
> scatterplot(childHeight ~ midparentHeight | gender, data=GF2,
+     ellipse=TRUE, levels=0.68, legend.coords=list(x=64, y=78))
>
> #########################################
> # relationship between heights of parents
> #########################################
>
> Parents <- subset(GaltonFamilies, !duplicated(GaltonFamilies$family))
>
> with(Parents, {
+   sunflowerplot(mother, father, rotate=TRUE, pch=16,
+      xlab="Mother height", ylab="Father height")
+ 	dataEllipse(mother, father, add=TRUE, plot.points=FALSE,
+      center.pch=NULL, levels=0.68)
+ 	abline(lm(father ~ mother), col="red", lwd=2)
+ 	}
+ 	)
>
>
>
>
>
>
> dev.off()
null device
          1
>
|