Supported by Dr. Osamu Ogasawara and  . . |
|
Last data update: 2014.03.03 |
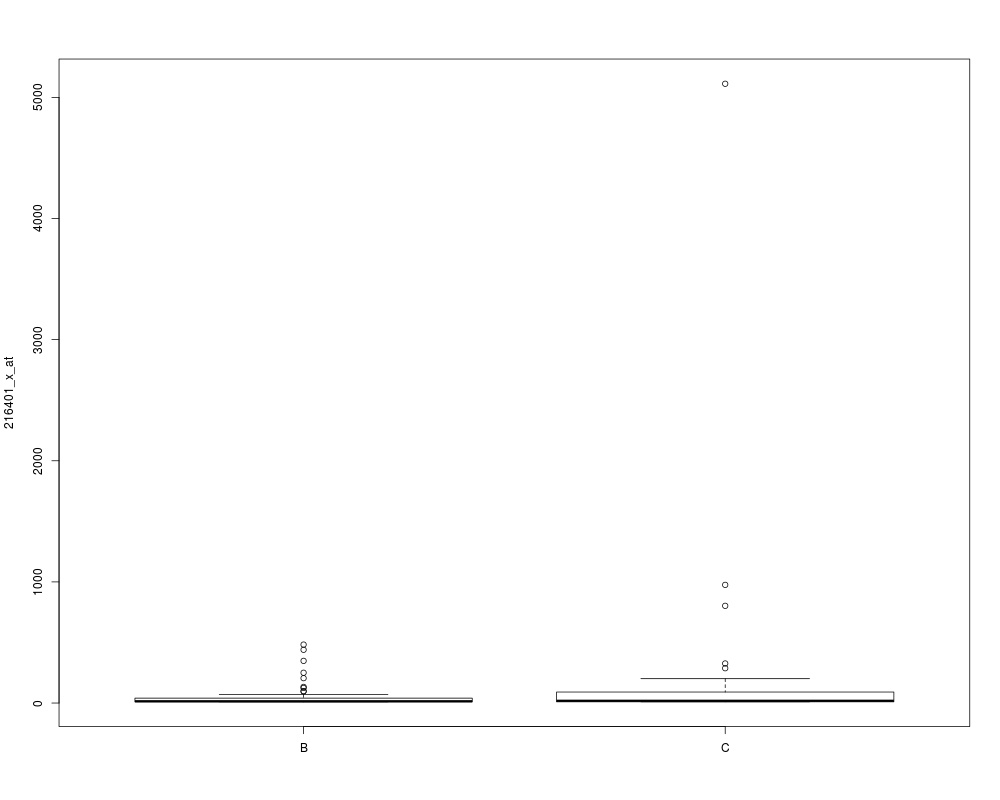
Chowdary DatabaseDescriptionThe original authors compared pairs of snap-frozen and RNAlater preservative-suspended tissue from lymph node-negative breast tumors (B) and Dukes' B colon tumors (C). The actual data set, by de Souto et. al (2008), is build with purpose of separating B from C. Usagedata(chowdary) FormatData frame with 183 rows and 104 columns. SourceActual source http://algorithmics.molgen.mpg.de/Static/Supplements/CompCancer/Affymetrix/chowdary-2006 Original source http://www.ncbi.nlm.nih.gov/geo/query/acc.cgi?acc=GSE3726 Referencesde Souto MCP, Costa IG, de Araujo DSA, Ludermir TB, and Schliep A (2008). Clustering Cancer Gene Expression Data: a Comparative Study. BMC Bioinformatics, 8, 497–511. Chowdary D, Lathrop J, Skelton J, Curtin K, Briggs T, Zhang Y, Yu J, Wang X, and Mazumder A (2006). Prognostic gene expression signatures can be measured in tissues collected in RNAlater preservative. Journal Molecular Diagnosis, 8, 31–39. Examplesdata(chowdary) tumor <- as.factor(as.matrix(chowdary[1,])) x <- as.matrix(chowdary[-1,]) mode(x) <- "numeric" s <- sample(row.names(x),1) boxplot( x[s,] ~ tumor , ylab=s) Results
R version 3.3.1 (2016-06-21) -- "Bug in Your Hair"
Copyright (C) 2016 The R Foundation for Statistical Computing
Platform: x86_64-pc-linux-gnu (64-bit)

R is free software and comes with ABSOLUTELY NO WARRANTY.
You are welcome to redistribute it under certain conditions.
Type 'license()' or 'licence()' for distribution details.

R is a collaborative project with many contributors.
Type 'contributors()' for more information and
'citation()' on how to cite R or R packages in publications.

Type 'demo()' for some demos, 'help()' for on-line help, or
'help.start()' for an HTML browser interface to help.
Type 'q()' to quit R.

> library(ICGE)
Loading required package: MASS
Loading required package: cluster
> png(filename="/home/ddbj/snapshot/RGM3/R_CC/result/ICGE/chowdary.Rd_%03d_medium.png", width=480, height=480)
> ### Name: chowdary
> ### Title: Chowdary Database
> ### Aliases: chowdary
> ### Keywords: datasets
>
> ### ** Examples
>
> data(chowdary)
>
> tumor <- as.factor(as.matrix(chowdary[1,]))
> x <- as.matrix(chowdary[-1,])
> mode(x) <- "numeric"
>
> s <- sample(row.names(x),1)
> boxplot( x[s,] ~ tumor , ylab=s)
>
>
>
>
>
> dev.off()
null device
          1
>
|