Supported by Dr. Osamu Ogasawara and  . . |
|
Last data update: 2014.03.03 |
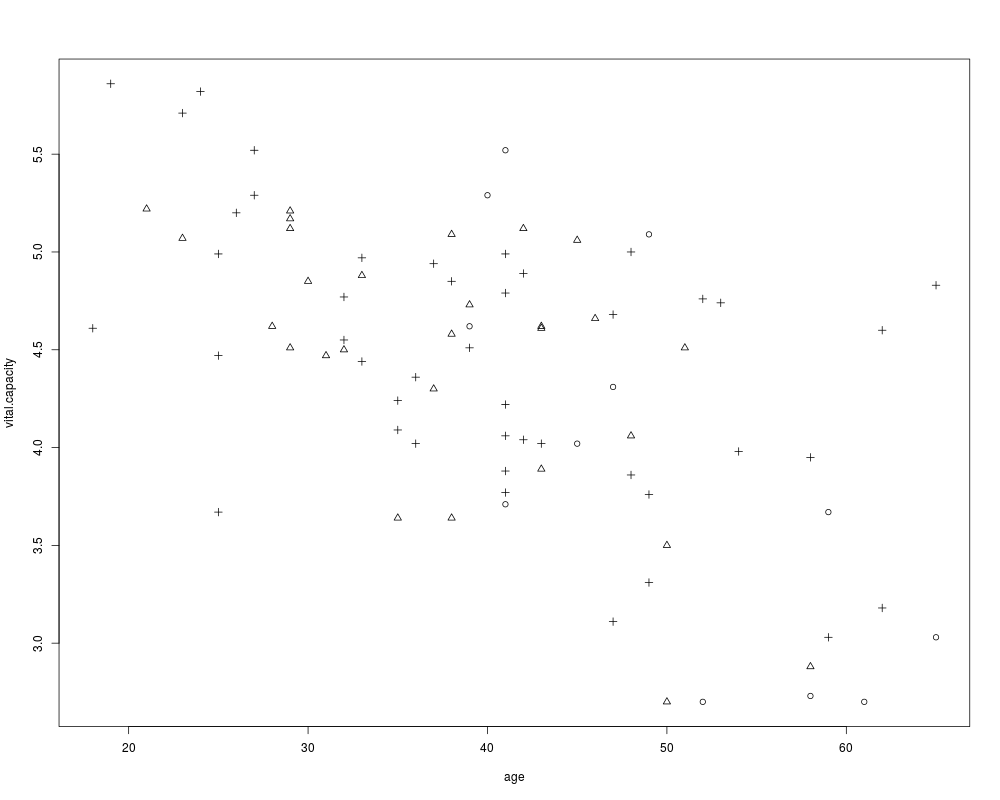
Vital capacity, full data setDescriptionThe Usagevitcap2 FormatThis data frame contains the following columns:
SourceP. Armitage and G. Berry (1987), Statistical Methods in Medical Research, 2nd ed., Blackwell, p.286. Examplesplot(vital.capacity~age, pch=group, data=vitcap2) Results
R version 3.3.1 (2016-06-21) -- "Bug in Your Hair"
Copyright (C) 2016 The R Foundation for Statistical Computing
Platform: x86_64-pc-linux-gnu (64-bit)

R is free software and comes with ABSOLUTELY NO WARRANTY.
You are welcome to redistribute it under certain conditions.
Type 'license()' or 'licence()' for distribution details.

R is a collaborative project with many contributors.
Type 'contributors()' for more information and
'citation()' on how to cite R or R packages in publications.

Type 'demo()' for some demos, 'help()' for on-line help, or
'help.start()' for an HTML browser interface to help.
Type 'q()' to quit R.

> library(ISwR)
> png(filename="/home/ddbj/snapshot/RGM3/R_CC/result/ISwR/vitcap2.Rd_%03d_medium.png", width=480, height=480)
> ### Name: vitcap2
> ### Title: Vital capacity, full data set
> ### Aliases: vitcap2
> ### Keywords: datasets
>
> ### ** Examples
>
> plot(vital.capacity~age, pch=group, data=vitcap2)
>
>
>
>
>
> dev.off()
null device
          1
>
|
Created & Maintained by Osamu Ogasawara (osamu.ogasawara@gmail.com) and 