Supported by Dr. Osamu Ogasawara and  . . |
|
Last data update: 2014.03.03 |
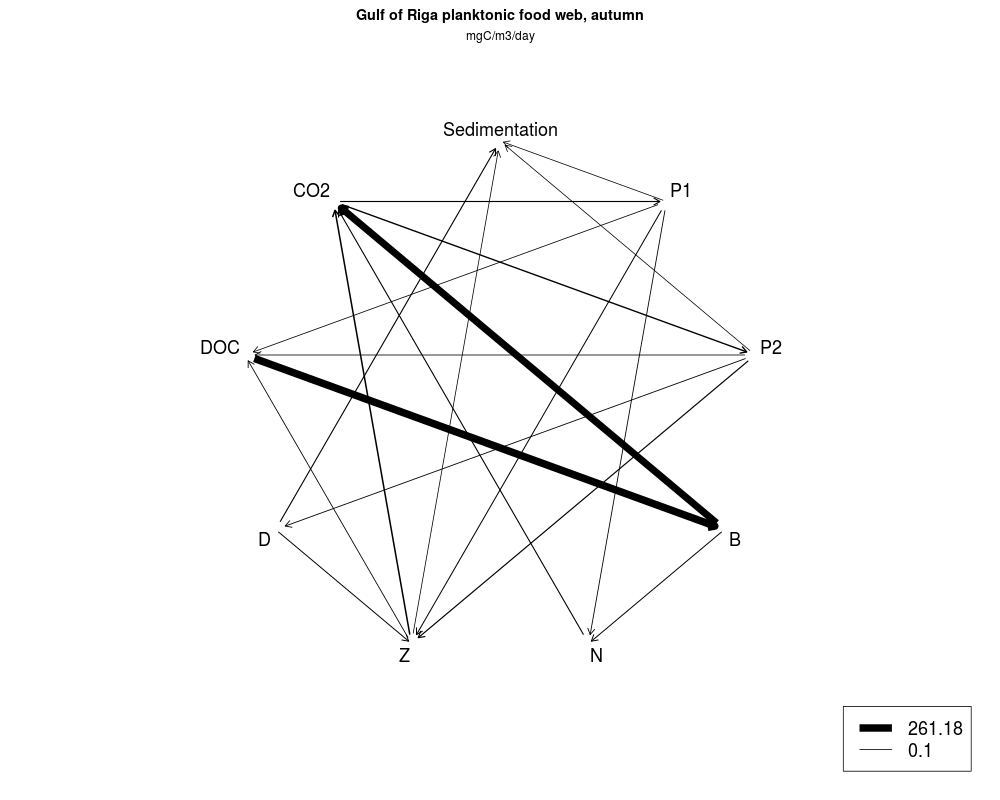
Linear inverse model specification for the Gulf of Riga *autumn* planktonic food webDescriptionLinear inverse model specification for the Gulf of Riga planktonic food web in *autumn* as in Donali et al. (1999). The Gulf of Riga is a highly eutrophic system in the Baltic Sea. The foodweb comprises 7 functional compartments and two external compartments, connected with 26 flows. Units of the flows are mg C/m3/day The linear inverse model LIMRigaAutumn is generated from the file
RigaAutumn.input which can be found in subdirectory In this subdirectory you will find many foodweb example input files These files can be read using Usagedata(LIMRigaAutumn) Formata list of matrices, vectors, names and values that specify the linear inverse model problem. see the return value of A more complete description of this structures is in vignette("LIM") Author(s)Karline Soetaert <karline.soetaert@nioz.nl> Dick van Oevelen<dick.vanoevelen@nioz.nl> ReferencesDonali, E., Olli, K., Heiskanen, A.S., Andersen, T., 1999. Carbon flow patterns in the planktonic food web of the Gulf of Riga, the Baltic Sea: a reconstruction by the inverse method. Journal of Marine Systems 23, 251..268. See AlsobrowseURL(paste(system.file(package="LIM"), "/doc/examples/Foodweb/", sep="")) contains "RigaAutumn.input", the input file; read this with
Examples
rigaAutumn <- Flowmatrix(LIMRigaAutumn)
plotweb(rigaAutumn, main = "Gulf of Riga planktonic food web, autumn",
sub = "mgC/m3/day")
# ranges of flows
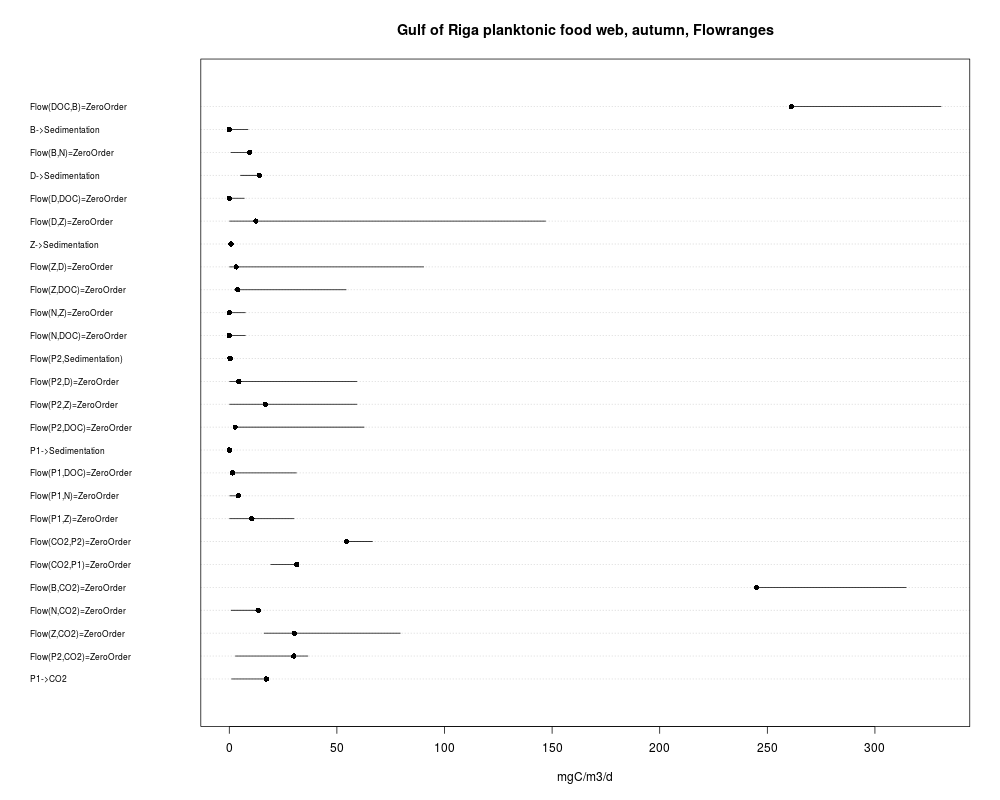
Plotranges(LIMRigaAutumn, lab.cex = 0.7, xlab = "mgC/m3/d",
main = "Gulf of Riga planktonic food web, autumn, Flowranges")
# ranges of variables
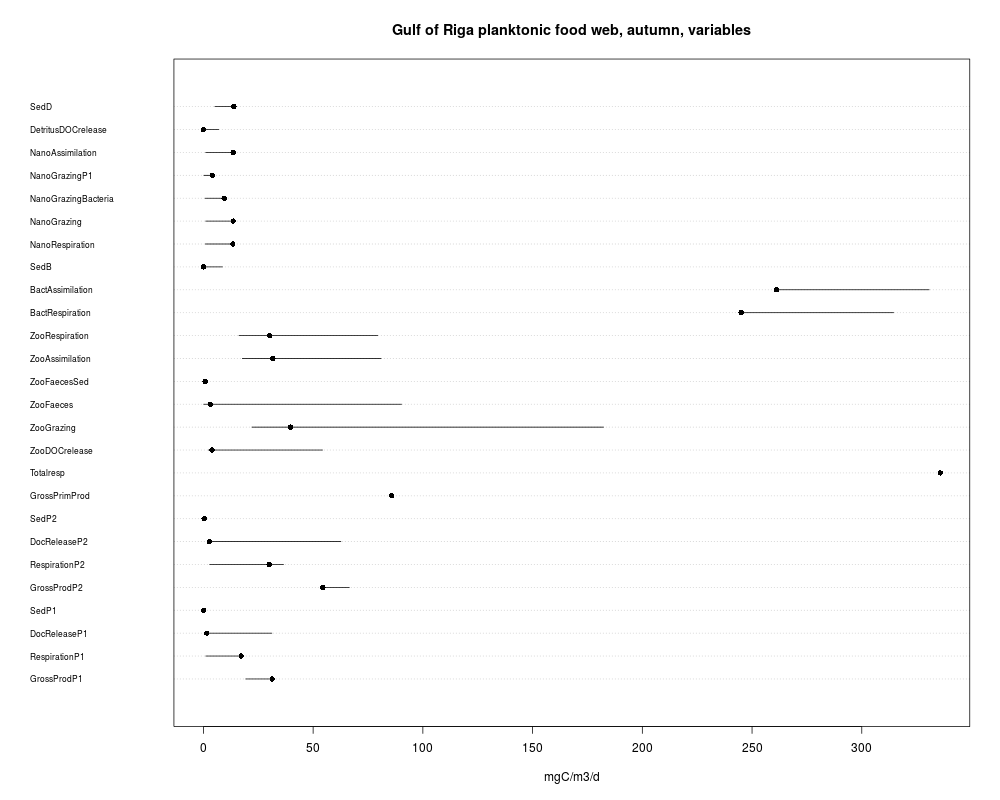
Plotranges(LIMRigaAutumn, type="V", lab.cex = 0.7, xlab = "mgC/m3/d",
main = "Gulf of Riga planktonic food web, autumn, variables")
Results
R version 3.3.1 (2016-06-21) -- "Bug in Your Hair"
Copyright (C) 2016 The R Foundation for Statistical Computing
Platform: x86_64-pc-linux-gnu (64-bit)

R is free software and comes with ABSOLUTELY NO WARRANTY.
You are welcome to redistribute it under certain conditions.
Type 'license()' or 'licence()' for distribution details.

R is a collaborative project with many contributors.
Type 'contributors()' for more information and
'citation()' on how to cite R or R packages in publications.

Type 'demo()' for some demos, 'help()' for on-line help, or
'help.start()' for an HTML browser interface to help.
Type 'q()' to quit R.

> library(LIM)
Loading required package: limSolve
Loading required package: diagram
Loading required package: shape
> png(filename="/home/ddbj/snapshot/RGM3/R_CC/result/LIM/LIMRigaAutumn.Rd_%03d_medium.png", width=480, height=480)
> ### Name: LIMRigaAutumn
> ### Title: Linear inverse model specification for the Gulf of Riga *autumn*
> ###   planktonic food web
> ### Aliases: LIMRigaAutumn
> ### Keywords: datasets
>
> ### ** Examples
>
> rigaAutumn <- Flowmatrix(LIMRigaAutumn)
> plotweb(rigaAutumn, main = "Gulf of Riga planktonic food web, autumn",
+         sub = "mgC/m3/day")
> # ranges of flows
> Plotranges(LIMRigaAutumn, lab.cex = 0.7, xlab = "mgC/m3/d",
+         main = "Gulf of Riga planktonic food web, autumn, Flowranges")
> # ranges of variables
> Plotranges(LIMRigaAutumn, type="V", lab.cex = 0.7, xlab = "mgC/m3/d",
+         main = "Gulf of Riga planktonic food web, autumn, variables")
>
>
>
>
>
> dev.off()
null device
          1
>
|