Supported by Dr. Osamu Ogasawara and  . . |
|
Last data update: 2014.03.03 |
Hall of Fame Voting DataDescriptionHall of Fame table. This is comprised of the voting results for all candidates nominated for the Baseball Hall of Fame. Usagedata(HallOfFame) FormatA data frame with 4088 observations on the following 9 variables.
DetailsThis table links to the
SourceLahman, S. (2015) Lahman's Baseball Database, 1871-2014, 2015 version, http://baseball1.com/statistics/ Examples
## Some examples for Hall of Fame induction data
data('HallOfFame')
require('plyr') ## extensive use of plyr for data manipulation
require('ggplot2')
############################################################
## Some simple queries
# What are the different types of votedBy?
table(HallOfFame$votedBy)
# What was the first year of Hall of Fame elections?
sort(unique(HallOfFame$yearID))[1]
# Who comprised the original class?
subset(HallOfFame, yearID == 1936 & inducted == 'Y')
# Result of a player's last year on the BBWAA ballot
# Restrict to players voted by BBWAA:
HOFplayers <- subset(HallOfFame, votedBy == 'BBWAA' & category == 'Player')
# Function to calculate number of years as HOF candidate, last pct vote, etc.
# for a given player
HOFun <- function(d) {
nyears <- nrow(d)
fy <- d[nyears, ]
lastPct <- with(fy, 100 * round(votes/ballots, 3))
data.frame(playerID = fy$playerID, nyears, induct = fy$inducted,
lastPct, lastYear = fy$yearID)
}
playerOutcomesHOF <- ddply(HOFplayers, .(playerID), HOFun)
############################################################
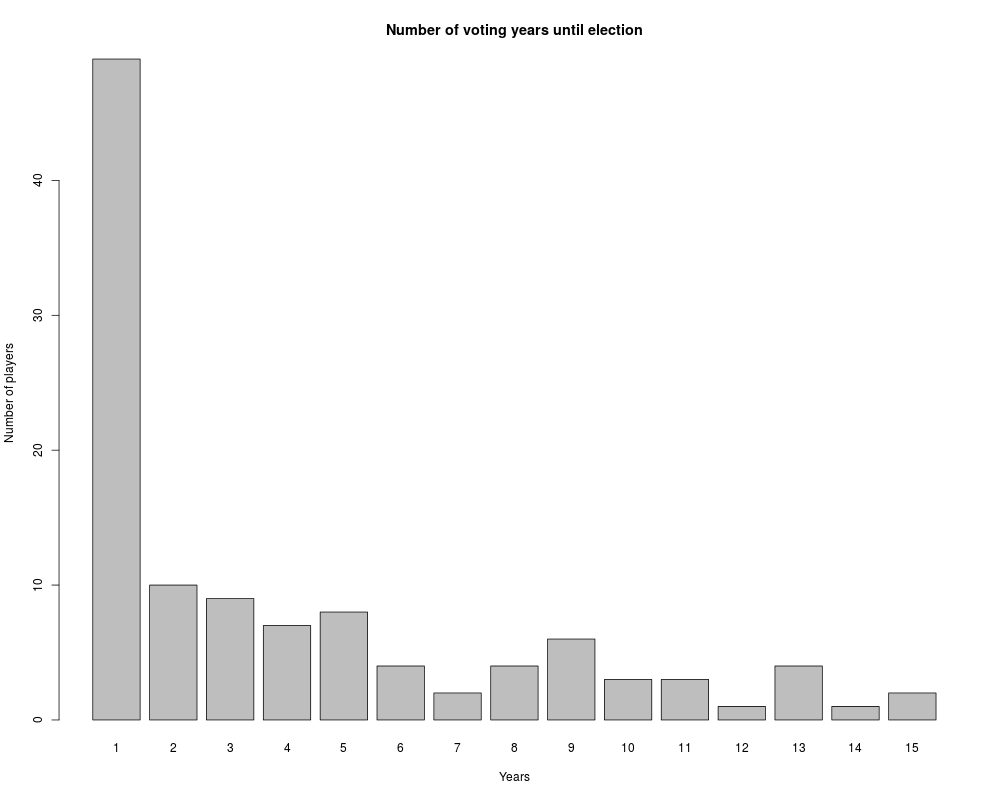
# How many voting years until election?
inducted <- subset(playerOutcomesHOF,induct == 'Y')
table(inducted$nyears)
barplot(table(inducted$nyears), main="Number of voting years until election",
ylab="Number of players", xlab="Years")
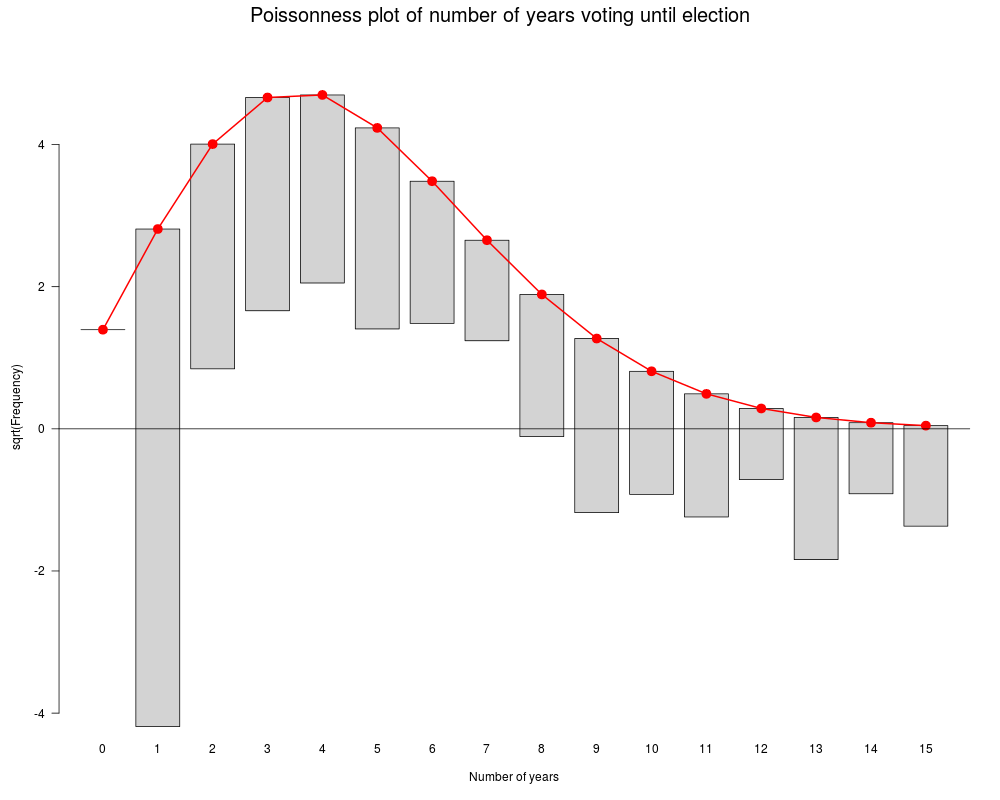
# What is the form of this distribution?
require('vcd')
goodfit(inducted$nyears)
plot(goodfit(inducted$nyears), xlab='Number of years',
main="Poissonness plot of number of years voting until election")
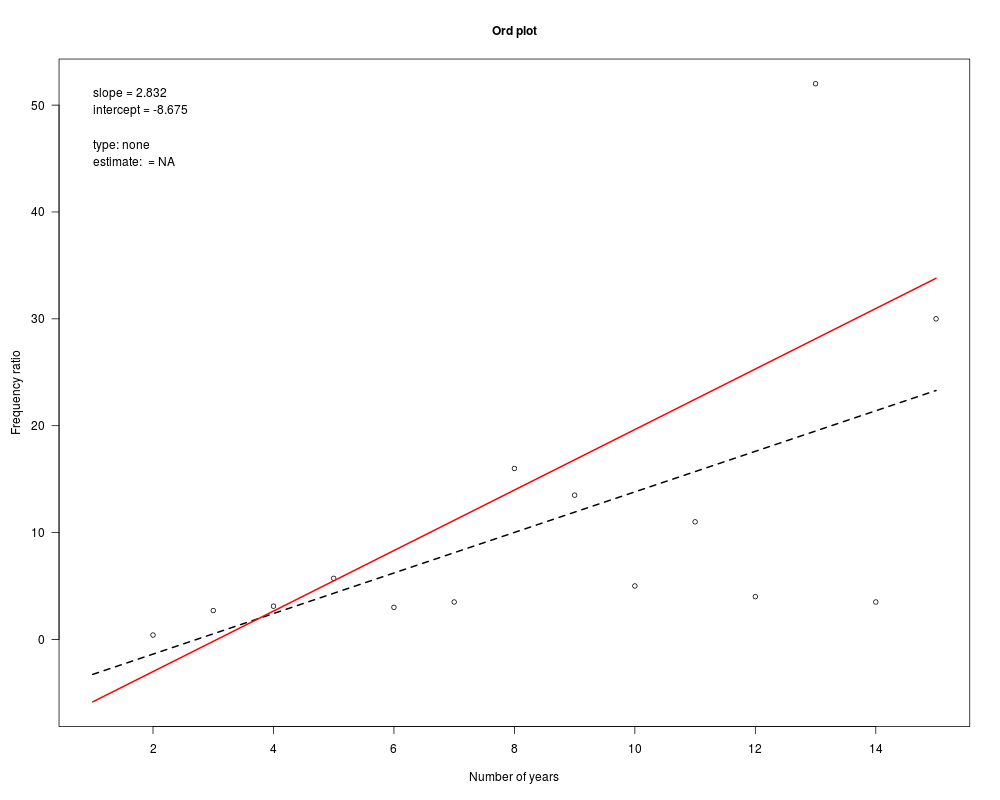
Ord_plot(table(inducted$nyears), xlab='Number of years')
# First ballot inductees:
subset(playerOutcomesHOF, nyears == 1L & induct == 'Y')
# Who took at least ten years on the ballot before induction?
# (Doesn't include Bert Blyleven, who was inducted in 2011.)
subset(playerOutcomesHOF, nyears >= 10L & induct == 'Y')
############################################################
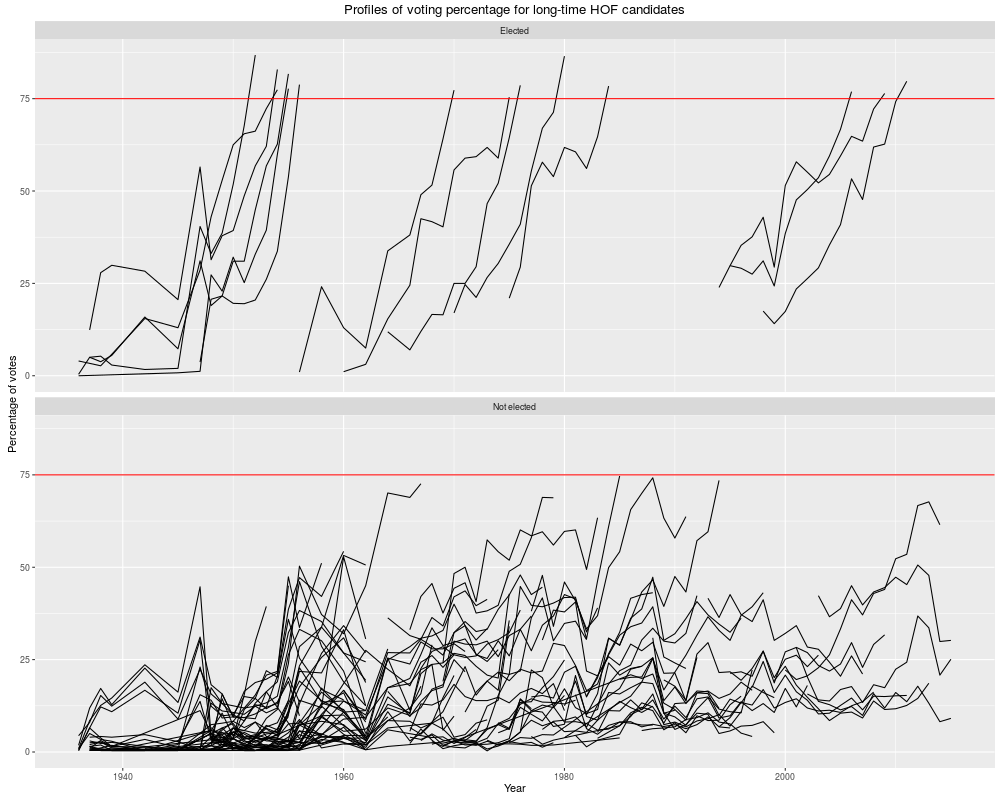
## Plots of voting percentages over time for the borderline
## HOF candidates, according to the BBWAA:
# (1) Set up the data:
longTimers <- as.character(unlist(subset(playerOutcomesHOF,
nyears >= 10, select = 'playerID')))
HOFlt <- subset(HallOfFame, playerID %in% longTimers & votedBy == 'BBWAA')
HOFlt <- ddply(HOFlt, .(playerID), mutate,
elected = ifelse(any(inducted == 'Y'),"Elected", "Not elected"),
pct = 100 * round(votes/ballots, 3))
# Plot the voting profiles:
ggplot(HOFlt, aes(x = yearID, y = pct,
group = playerID)) +
ggtitle("Profiles of voting percentage for long-time HOF candidates") +
geom_line() +
geom_hline(yintercept = 75, col = 'red') +
labs(list(x = "Year", y = "Percentage of votes")) +
facet_wrap(~ elected, ncol = 1)
# Note: All but one of the players whose maximum voting percentage
# was over 60% and was not elected by the BBWAA has eventually been inducted
# into the HOF. Red Ruffing was elected in a 1967 runoff election while
# the others have been voted in by the Veterans Committee. The lone
# exception is Gil Hodges; his profile is the one that flatlines around 60%
# for several years in the late 70s and early 80s.
Results
R version 3.3.1 (2016-06-21) -- "Bug in Your Hair"
Copyright (C) 2016 The R Foundation for Statistical Computing
Platform: x86_64-pc-linux-gnu (64-bit)

R is free software and comes with ABSOLUTELY NO WARRANTY.
You are welcome to redistribute it under certain conditions.
Type 'license()' or 'licence()' for distribution details.

R is a collaborative project with many contributors.
Type 'contributors()' for more information and
'citation()' on how to cite R or R packages in publications.

Type 'demo()' for some demos, 'help()' for on-line help, or
'help.start()' for an HTML browser interface to help.
Type 'q()' to quit R.

> library(Lahman)
> png(filename="/home/ddbj/snapshot/RGM3/R_CC/result/Lahman/HallOfFame.Rd_%03d_medium.png", width=480, height=480)
> ### Name: HallOfFame
> ### Title: Hall of Fame Voting Data
> ### Aliases: HallOfFame
> ### Keywords: datasets
>
> ### ** Examples
>
> ## Some examples for  Hall of Fame induction data
>
> data('HallOfFame')
> require('plyr')          ## extensive use of plyr for data manipulation
Loading required package: plyr
> require('ggplot2')
Loading required package: ggplot2
>
> ############################################################
> ## Some simple queries
>
> # What are the different types of votedBy?
> table(HallOfFame$votedBy)

           BBWAA       Centennial     Final Ballot     Negro League
            3657                6               21               26
 Nominating Vote       Old Timers          Run Off Special Election
              76               30               81                2
        Veterans
             189
>
> # What was the first year of Hall of Fame elections?
> sort(unique(HallOfFame$yearID))[1]
[1] 1936
> # Who comprised the original class?
> subset(HallOfFame, yearID == 1936 & inducted == 'Y')
   playerID yearID votedBy ballots needed votes inducted category needed_note
1  cobbty01   1936   BBWAA     226    170   222        Y   Player        <NA>
2  ruthba01   1936   BBWAA     226    170   215        Y   Player        <NA>
3 wagneho01   1936   BBWAA     226    170   215        Y   Player        <NA>
4 mathech01   1936   BBWAA     226    170   205        Y   Player        <NA>
5 johnswa01   1936   BBWAA     226    170   189        Y   Player        <NA>
>
> # Result of a player's last year on the BBWAA ballot
> # Restrict to players voted by BBWAA:
> HOFplayers <- subset(HallOfFame, votedBy == 'BBWAA' & category == 'Player')
>
>
> # Function to calculate number of years as HOF candidate, last pct vote, etc.
> # for a given player
> HOFun <- function(d) {
+     nyears <- nrow(d)
+     fy <- d[nyears, ]
+     lastPct <- with(fy, 100 * round(votes/ballots, 3))
+     data.frame(playerID = fy$playerID, nyears, induct = fy$inducted,
+                lastPct, lastYear = fy$yearID)
+ }
>
> playerOutcomesHOF <- ddply(HOFplayers, .(playerID), HOFun)
>
>
> ############################################################
> # How many voting years until election?
> inducted <- subset(playerOutcomesHOF,induct == 'Y')
> table(inducted$nyears)

 1  2  3  4  5  6  7  8  9 10 11 12 13 14 15
49 10  9  7  8  4  2  4  6  3  3  1  4  1  2
> barplot(table(inducted$nyears), main="Number of voting years until election",
+ 		ylab="Number of players", xlab="Years")
>
> # What is the form of this distribution?
> require('vcd')
Loading required package: vcd
Loading required package: grid
> goodfit(inducted$nyears)

Observed and fitted values for poisson distribution
with parameters estimated by `ML'

 count observed       fitted pearson residual
     0        0  1.945348067        -1.394757
     1       49  7.901900557        14.620289
     2       10 16.048550247        -1.509849
     3        9 21.729452989        -2.730771
     4        7 22.065971066        -3.207271
     5        8 17.926160565        -2.344432
     6        4 12.135852064        -2.335436
     7        2  7.042169529        -1.900046
     8        4  3.575614838         0.224432
     9        6  1.613773069         3.452788
    10        3  0.655506052         2.895748
    11        3  0.242057343         5.605652
    12        1  0.081935340         3.207286
    13        4  0.025601308        24.839357
    14        1  0.007427939        11.516695
    15        2  0.002011460        38.588634
> plot(goodfit(inducted$nyears), xlab='Number of years',
+ 	main="Poissonness plot of number of years voting until election")
> Ord_plot(table(inducted$nyears), xlab='Number of years')
>
>
>
> # First ballot inductees:
> subset(playerOutcomesHOF, nyears == 1L & induct == 'Y')
      playerID nyears induct lastPct lastYear
1    aaronha01      1      Y    97.8     1982
41   bankser01      1      Y    83.8     1977
60   benchjo01      1      Y    96.4     1989
87   boggswa01      1      Y    91.9     2005
106  brettge01      1      Y    98.2     1999
111  brocklo01      1      Y    79.7     1985
151  carewro01      1      Y    90.5     1991
153  carltst01      1      Y    95.6     1994
188   cobbty01      1      Y    98.2     1936
283  eckerde01      1      Y    83.2     2004
304  fellebo01      1      Y    93.8     1962
355  gibsobo01      1      Y    84.0     1981
360  glavito01      1      Y    91.9     2014
402  gwynnto01      1      Y    97.6     2007
429  henderi01      1      Y    94.8     2009
478  jacksre01      1      Y    93.6     1993
491  johnsra05      1      Y    97.3     2015
492  johnswa01      1      Y    83.6     1936
510  kalinal01      1      Y    88.3     1980
542  koufasa01      1      Y    86.9     1972
601  maddugr01      1      Y    97.2     2014
607  mantlmi01      1      Y    88.2     1974
621  martipe02      1      Y    91.1     2015
623  mathech01      1      Y    90.7     1936
635   mayswi01      1      Y    94.7     1979
641  mccovwi01      1      Y    81.4     1986
683  molitpa01      1      Y    85.2     2004
694  morgajo02      1      Y    81.8     1990
708  murraed02      1      Y    85.3     2003
711  musiast01      1      Y    93.2     1969
748  palmeji01      1      Y    92.6     1990
788  puckeki01      1      Y    82.1     2001
821  ripkeca01      1      Y    98.5     2007
829  robinbr01      1      Y    92.0     1983
830  robinfr02      1      Y    89.2     1982
831  robinja02      1      Y    77.5     1962
851   ruthba01      1      Y    95.1     1936
853   ryanno01      1      Y    98.8     1999
874  schmimi01      1      Y    96.5     1995
884  seaveto01      1      Y    98.8     1992
918  smithoz01      1      Y    91.7     2002
921  smoltjo01      1      Y    82.9     2015
937  stargwi01      1      Y    82.4     1988
976  thomafr04      1      Y    83.7     2014
1021 wagneho01      1      Y    95.1     1936
1063 willite01      1      Y    93.4     1966
1069 winfida01      1      Y    84.5     2001
1082 yastrca01      1      Y    94.6     1989
1090 yountro01      1      Y    77.5     1999
>
> # Who took at least ten years on the ballot before induction?
> # (Doesn't include Bert Blyleven, who was inducted in 2011.)
> subset(playerOutcomesHOF, nyears >= 10L & induct == 'Y')
      playerID nyears induct lastPct lastYear
83   blylebe01     14      Y    79.7     2011
97   boudrlo01     10      Y    77.3     1970
216  cronijo01     10      Y    78.8     1956
271  drysddo01     10      Y    78.4     1984
420  hartnga01     11      Y    77.7     1955
425  heilmha01     11      Y    86.8     1952
528  kinerra01     13      Y    75.4     1975
570  lemonbo01     12      Y    78.6     1976
609  maranra01     13      Y    82.9     1954
813   riceji01     15      Y    76.4     2009
922  snidedu01     11      Y    86.5     1980
960  suttebr01     13      Y    76.9     2006
972  terrybi01     13      Y    77.4     1954
1007 vanceda01     15      Y    81.7     1955
>
> ############################################################
> ## Plots of voting percentages over time for the borderline
> ## HOF candidates, according to the BBWAA:
>
> # (1) Set up the data:
> longTimers <- as.character(unlist(subset(playerOutcomesHOF,
+                                          nyears >= 10, select = 'playerID')))
> HOFlt <- subset(HallOfFame, playerID %in% longTimers & votedBy == 'BBWAA')
> HOFlt <- ddply(HOFlt, .(playerID), mutate,
+                   elected = ifelse(any(inducted == 'Y'),"Elected", "Not elected"),
+                   pct = 100 * round(votes/ballots, 3))
>
> # Plot the voting profiles:
> ggplot(HOFlt, aes(x = yearID, y = pct,
+                   group = playerID)) +
+     ggtitle("Profiles of voting percentage for long-time HOF candidates") +
+     geom_line() +
+     geom_hline(yintercept = 75, col = 'red') +
+     labs(list(x = "Year", y = "Percentage of votes")) +
+     facet_wrap(~ elected, ncol = 1)
>
> # Note: All but one of the players whose maximum voting percentage
> # was over 60% and was not elected by the BBWAA has eventually been inducted
> # into the HOF. Red Ruffing was elected in a 1967 runoff election while
> # the others have been voted in by the Veterans Committee. The lone
> # exception is Gil Hodges; his profile is the one that flatlines around 60%
> # for several years in the late 70s and early 80s.
>
>
>
>
>
> dev.off()
null device
          1
>
|