Supported by Dr. Osamu Ogasawara and  . . |
|
Last data update: 2014.03.03 |
Managers tableDescriptionManagers table: information about individual team managers, teams they managed and some basic statistics for those teams in each year. Usagedata(Managers) FormatA data frame with 3370 observations on the following 10 variables.
SourceLahman, S. (2015) Lahman's Baseball Database, 1871-2014, 2015 version, http://baseball1.com/statistics/ Examples
####################################
# Basic career summaries by manager
####################################
library('plyr')
mgrsumm <- function(d) {
df <- data.frame(with(d,
nyear = length(unique(yearID)),
yearBegin = min(yearID),
yearEnd = max(yearID),
nTeams = length(unique(teamID)),
nfirst = sum(rank == 1L),
W = sum(W),
L = sum(L),
WinPct = round(W/(W + L), 3)))
df
}
mgrTotals <- ddply(Managers, .(playerID), summarise,
nyear = length(unique(yearID)),
yearBegin = min(yearID),
yearEnd = max(yearID),
nTeams = length(unique(teamID)),
nfirst = sum(rank == 1L),
games = sum(W + L),
W = sum(W),
L = sum(L),
WinPct = round(sum(W)/sum(W + L), 3))
mgrTotals <- merge(mgrTotals,
subset(Master, !is.na(playerID),
select = c('playerID', 'nameLast', 'nameFirst')),
by = 'playerID')
##########################
# Some basic queries
##########################
# Top 20 managers in terms of years of service:
head(arrange(mgrTotals, -nyear), 20)
# Top 20 winningest managers (500 games minimum)
head(arrange(subset(mgrTotals, games >= 500), -WinPct), 20)
# Hmm. Most of these are 19th century managers.
# How about the modern era?
head(arrange(subset(mgrTotals, yearBegin >= 1900 & games >= 500), -WinPct), 20)
# Top 10 managers in terms of percentage of titles (league or divisional) -
# should bias toward managers post-1970 since more first place finishes
# are available
head(arrange(subset(mgrTotals, yearBegin >= 1900 & games >= 500),
-round(nfirst/nyear, 3)), 10)
# How about pre-1969?
head(arrange(subset(mgrTotals,
yearBegin >= 1900 & yearEnd <= 1969 & games >= 500),
-round(nfirst/nyear, 3)), 10)
##############################################
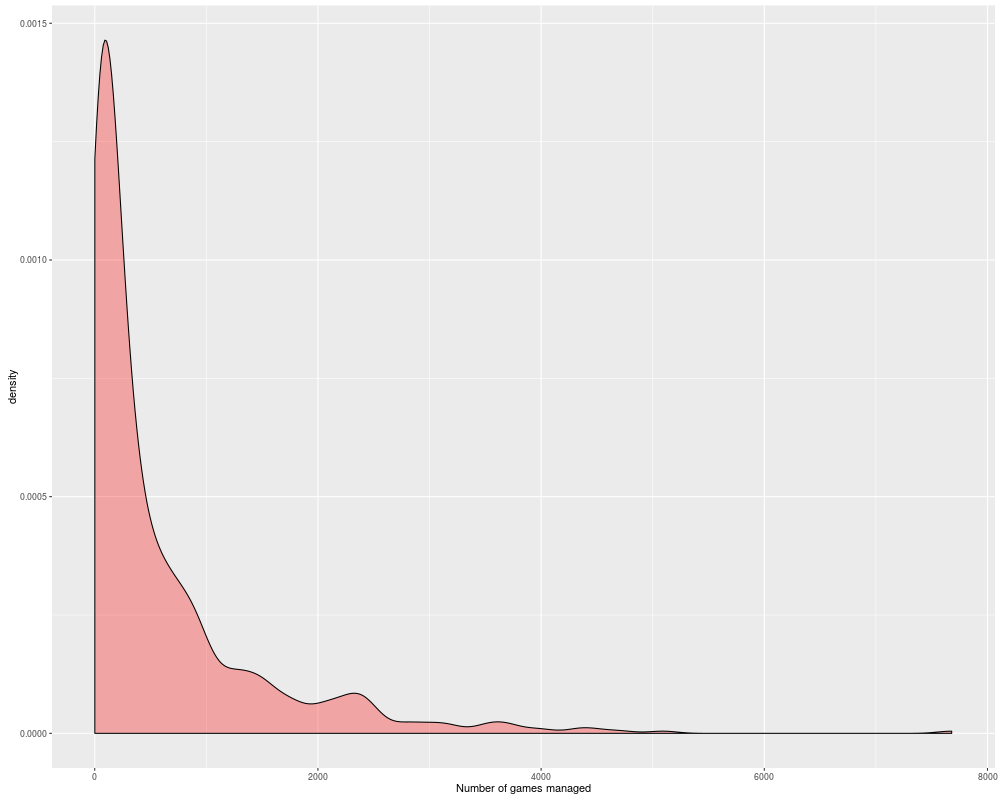
# Density plot of the number of games managed:
##############################################
library('ggplot2')
ggplot(mgrTotals, aes(x = games)) + geom_density(fill = 'red', alpha = 0.3) +
labs(x = 'Number of games managed')
# Who managed more than 4000 games?
subset(mgrTotals, games >= 4000)
# Connie Mack had an advantage: he owned the Philadelphia A's :)
# Table of Tony LaRussa's team finishes:
with(subset(Managers, playerID == 'larusto01'), table(rank))
# To include zero frequencies, one alternative is the tabulate() function:
with(subset(Managers, playerID == 'larusto01'), tabulate(rank, 7))
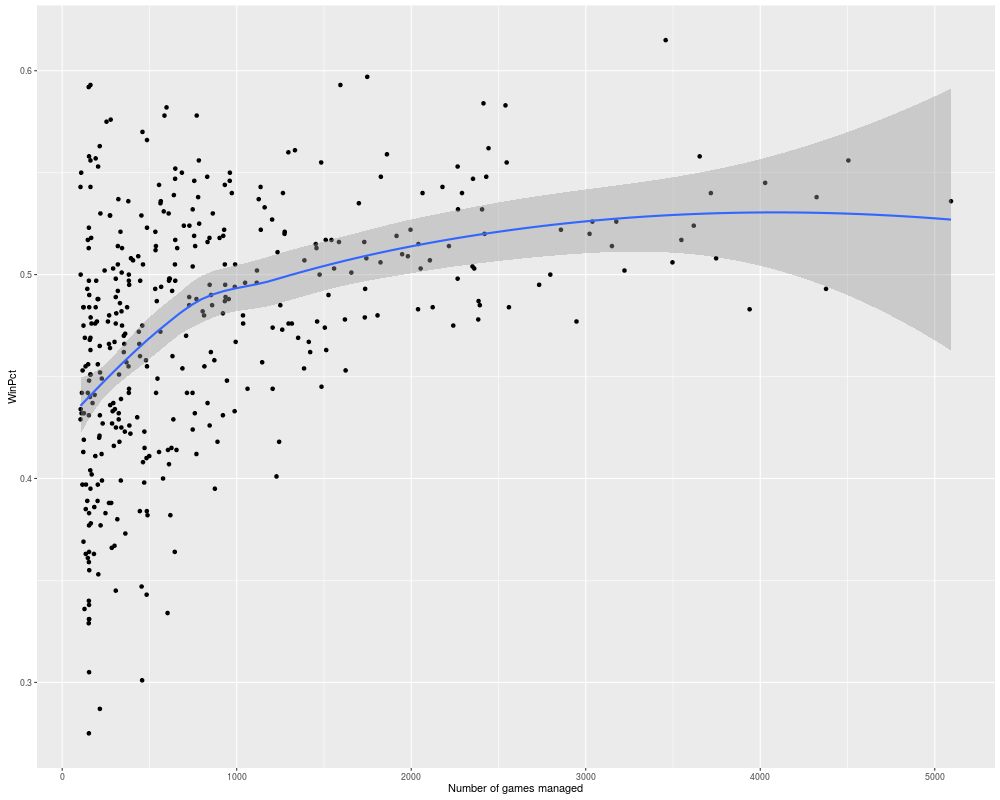
##############################################
# Scatterplot of winning percentage vs. number of games managed (min 100)
##############################################
ggplot(subset(mgrTotals, yearBegin >= 1900 & games >= 100),
aes(x = games, y = WinPct)) + geom_point() + geom_smooth() +
labs(x = 'Number of games managed')
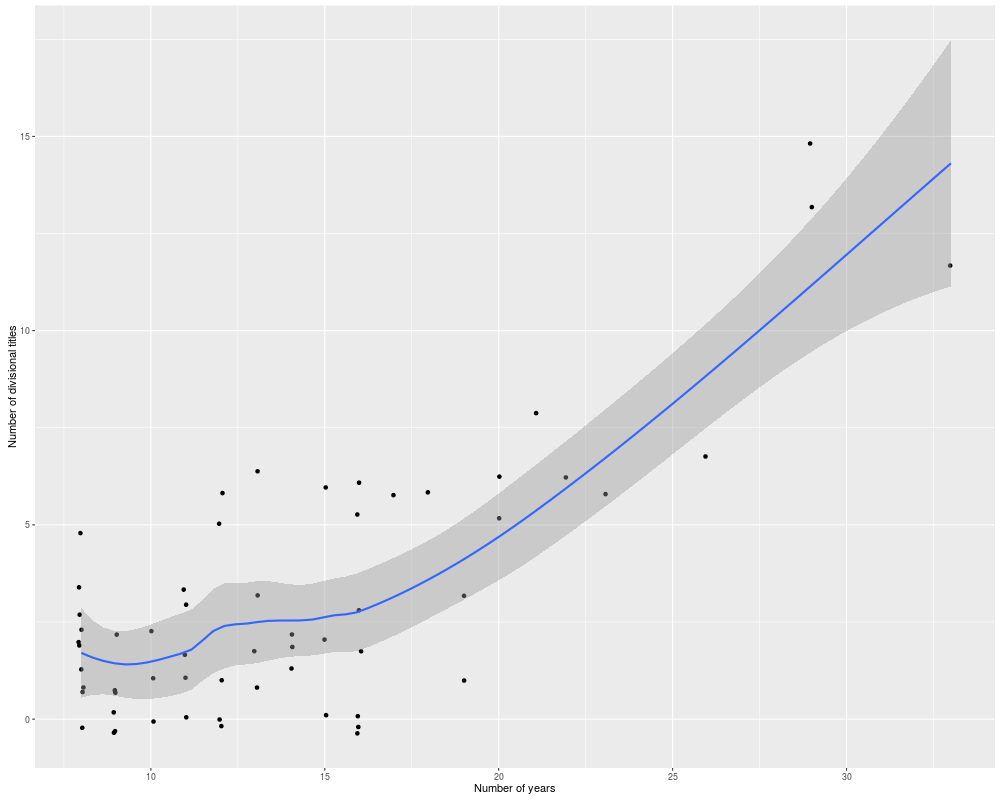
############################################
# Division titles
############################################
# Plot of number of first place finishes by managers with at least 8 years
# of experience in the divisional era (>= 1969):
divMgr <- subset(mgrTotals, yearBegin >= 1969 & nyear >= 8)
# Response is the number of titles
ggplot(divMgr, aes(x = nyear, y = nfirst)) +
geom_point(position = position_jitter(w = 0.2)) +
labs(x = 'Number of years', y = 'Number of divisional titles') +
geom_smooth()
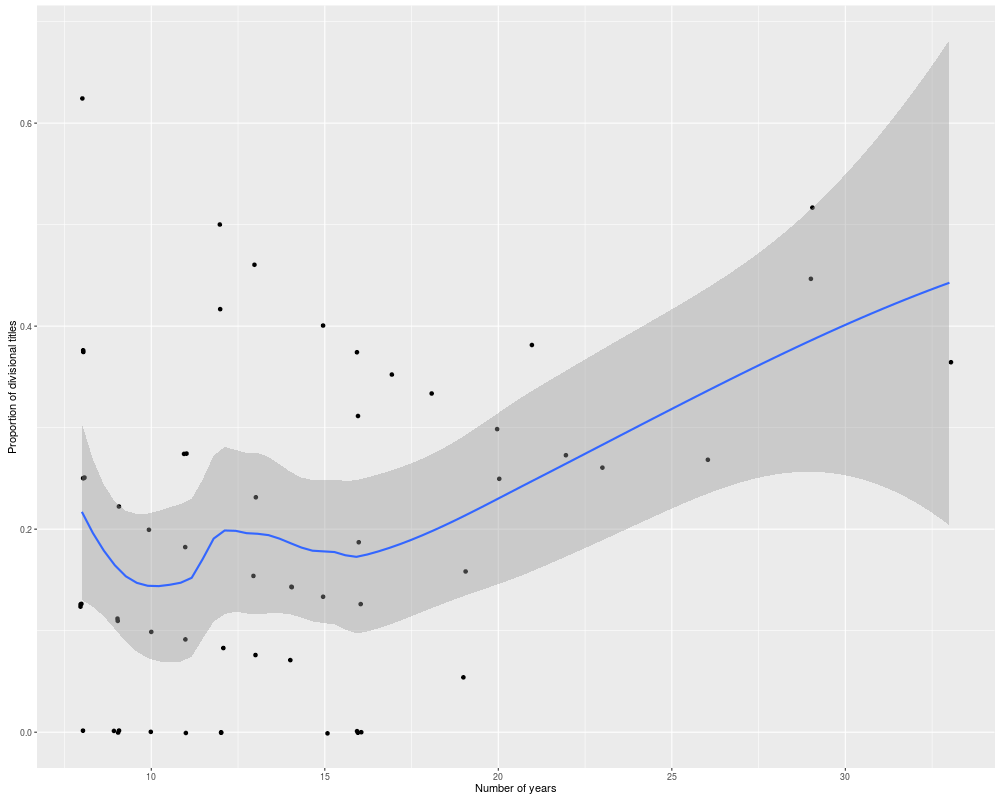
# Response is the proportion of titles
ggplot(divMgr, aes(x = nyear, y = round(nfirst/nyear, 3))) +
geom_point(position = position_jitter(w = 0.2)) +
labs(x = 'Number of years', y = 'Proportion of divisional titles') +
geom_smooth()
Results
R version 3.3.1 (2016-06-21) -- "Bug in Your Hair"
Copyright (C) 2016 The R Foundation for Statistical Computing
Platform: x86_64-pc-linux-gnu (64-bit)

R is free software and comes with ABSOLUTELY NO WARRANTY.
You are welcome to redistribute it under certain conditions.
Type 'license()' or 'licence()' for distribution details.

R is a collaborative project with many contributors.
Type 'contributors()' for more information and
'citation()' on how to cite R or R packages in publications.

Type 'demo()' for some demos, 'help()' for on-line help, or
'help.start()' for an HTML browser interface to help.
Type 'q()' to quit R.

> library(Lahman)
> png(filename="/home/ddbj/snapshot/RGM3/R_CC/result/Lahman/Managers.Rd_%03d_medium.png", width=480, height=480)
> ### Name: Managers
> ### Title: Managers table
> ### Aliases: Managers
> ### Keywords: datasets
>
> ### ** Examples
>
> ####################################
> # Basic career summaries by manager
> ####################################
>
> library('plyr')
> mgrsumm <- function(d) {
+     df <- data.frame(with(d,
+               nyear = length(unique(yearID)),
+               yearBegin = min(yearID),
+               yearEnd = max(yearID),
+               nTeams = length(unique(teamID)),
+               nfirst = sum(rank == 1L),
+               W = sum(W),
+               L = sum(L),
+               WinPct = round(W/(W + L), 3)))
+     df
+ }
>
> mgrTotals <- ddply(Managers, .(playerID), summarise,
+                   nyear = length(unique(yearID)),
+                   yearBegin = min(yearID),
+                   yearEnd = max(yearID),
+                   nTeams = length(unique(teamID)),
+                   nfirst = sum(rank == 1L),
+                   games = sum(W + L),
+                   W = sum(W),
+                   L = sum(L),
+                   WinPct = round(sum(W)/sum(W + L), 3))
> mgrTotals <- merge(mgrTotals,
+                    subset(Master, !is.na(playerID),
+                           select = c('playerID', 'nameLast', 'nameFirst')),
+                    by = 'playerID')
>
> ##########################
> # Some basic queries
> ##########################
>
> # Top 20 managers in terms of years of service:
> head(arrange(mgrTotals, -nyear), 20)
    playerID nyear yearBegin yearEnd nTeams nfirst games    W    L WinPct
1   mackco01    53      1894    1950      2      9  7679 3731 3948  0.486
2  larusto01    33      1979    2011      3     12  5093 2728 2365  0.536
3  mcgrajo01    33      1899    1932      3     11  4711 2763 1948  0.586
4    coxbo01    29      1978    2010      2     15  4505 2504 2001  0.556
5  harribu01    29      1924    1956      5      3  4377 2158 2219  0.493
6  torrejo01    29      1977    2010      5     13  4323 2326 1997  0.538
7  andersp01    26      1970    1995      2      7  4028 2194 1834  0.545
8  mauchge01    26      1960    1987      4      2  3939 1902 2037  0.483
9  mckecbi01    25      1915    1946      5      4  3619 1896 1723  0.524
10 stengca01    25      1934    1965      4     10  3747 1905 1842  0.508
11 durocle01    24      1939    1973      4      3  3717 2008 1709  0.540
12 mccarjo99    24      1926    1950      3      9  3458 2125 1333  0.615
13 alstowa01    23      1954    1976      2      7  3653 2040 1613  0.558
14 pinielo01    23      1986    2010      5      6  3548 1835 1713  0.517
15 wrighha01    23      1871    1893      4      6  2110 1225  885  0.581
16 leylaji99    22      1986    2013      4      6  3497 1769 1728  0.506
17 ansonca01    21      1875    1898      3      5  2243 1296  947  0.578
18 dykesji01    21      1934    1961      6      0  2947 1406 1541  0.477
19 lasorto01    21      1976    1996      1      8  3038 1599 1439  0.526
20 willidi02    21      1967    1988      6      6  3022 1571 1451  0.520
    nameLast nameFirst
1       Mack    Connie
2    LaRussa      Tony
3     McGraw      John
4        Cox     Bobby
5     Harris     Bucky
6      Torre       Joe
7   Anderson    Sparky
8      Mauch      Gene
9  McKechnie      Bill
10   Stengel     Casey
11  Durocher       Leo
12  McCarthy       Joe
13    Alston    Walter
14  Piniella       Lou
15    Wright     Harry
16   Leyland       Jim
17     Anson       Cap
18     Dykes     Jimmy
19   Lasorda       Tom
20  Williams      Dick
>
> # Top 20 winningest managers (500 games minimum)
> head(arrange(subset(mgrTotals, games >= 500), -WinPct), 20)
    playerID nyear yearBegin yearEnd nTeams nfirst games    W    L WinPct
1  mccarjo99    24      1926    1950      3      9  3458 2125 1333  0.615
2  mutriji99     9      1883    1891      2      3  1077  658  419  0.611
3  comisch01    12      1883    1894      3      4  1381  840  541  0.608
4  seleefr99    16      1890    1905      2      5  2146 1284  862  0.598
5  southbi01    13      1929    1951      2      4  1748 1044  704  0.597
6  chancfr01    11      1905    1923      3      4  1594  946  648  0.593
7  mcgrajo01    33      1899    1932      3     11  4711 2763 1948  0.586
8  lopezal01    17      1951    1969      2      2  2414 1410 1004  0.584
9  weaveea99    17      1968    1986      1      6  2540 1480 1060  0.583
10 cochrmi01     5      1934    1938      1      2   598  348  250  0.582
11 wrighha01    23      1871    1893      4      6  2110 1225  885  0.581
12 ansonca01    21      1875    1898      3      5  2243 1296  947  0.578
13  dyered01     5      1946    1950      1      1   771  446  325  0.578
14 rowlapa99     4      1915    1918      1      1   586  339  247  0.578
15 clarkfr01    19      1897    1915      2      4  2783 1602 1181  0.576
16 mcgunbi01     5      1888    1896      4      2   575  327  248  0.569
17  wardjo01     7      1880    1894      4      0   732  412  320  0.563
18 johnsda02    17      1984    2013      5      6  2443 1372 1071  0.562
19 moranpa01     9      1915    1923      2      2  1334  748  586  0.561
20 girarjo01     8      2006    2014      2      3  1296  726  570  0.560
     nameLast nameFirst
1    McCarthy       Joe
2      Mutrie       Jim
3    Comiskey   Charlie
4       Selee     Frank
5  Southworth     Billy
6      Chance     Frank
7      McGraw      John
8       Lopez        Al
9      Weaver      Earl
10   Cochrane    Mickey
11     Wright     Harry
12      Anson       Cap
13       Dyer     Eddie
14    Rowland     Pants
15     Clarke      Fred
16 McGunnigle      Bill
17       Ward     Monte
18    Johnson     Davey
19      Moran       Pat
20    Girardi       Joe
>
> # Hmm. Most of these are 19th century managers.
> # How about the modern era?
> head(arrange(subset(mgrTotals, yearBegin >= 1900 & games >= 500), -WinPct), 20)
    playerID nyear yearBegin yearEnd nTeams nfirst games    W    L WinPct
1  mccarjo99    24      1926    1950      3      9  3458 2125 1333  0.615
2  southbi01    13      1929    1951      2      4  1748 1044  704  0.597
3  chancfr01    11      1905    1923      3      4  1594  946  648  0.593
4  lopezal01    17      1951    1969      2      2  2414 1410 1004  0.584
5  weaveea99    17      1968    1986      1      6  2540 1480 1060  0.583
6  cochrmi01     5      1934    1938      1      2   598  348  250  0.582
7   dyered01     5      1946    1950      1      1   771  446  325  0.578
8  rowlapa99     4      1915    1918      1      1   586  339  247  0.578
9  johnsda02    17      1984    2013      5      6  2443 1372 1071  0.562
10 moranpa01     9      1915    1923      2      2  1334  748  586  0.561
11 girarjo01     8      2006    2014      2      3  1296  726  570  0.560
12 oneilst01    14      1935    1954      4      1  1861 1040  821  0.559
13 alstowa01    23      1954    1976      2      7  3653 2040 1613  0.558
14   coxbo01    29      1978    2010      2     15  4505 2504 2001  0.556
15 dierkla01     5      1997    2001      1      5   783  435  348  0.556
16 huggimi01    17      1913    1929      2      6  2547 1413 1134  0.555
17 terrybi01    10      1932    1941      1      3  1484  823  661  0.555
18 martibi02    16      1969    1988      5      6  2266 1253 1013  0.553
19 littlgr99     4      2002    2007      2      0   648  358  290  0.552
20 johnswa01     7      1929    1935      2      0   961  529  432  0.550
     nameLast nameFirst
1    McCarthy       Joe
2  Southworth     Billy
3      Chance     Frank
4       Lopez        Al
5      Weaver      Earl
6    Cochrane    Mickey
7        Dyer     Eddie
8     Rowland     Pants
9     Johnson     Davey
10      Moran       Pat
11    Girardi       Joe
12    O'Neill     Steve
13     Alston    Walter
14        Cox     Bobby
15    Dierker     Larry
16    Huggins    Miller
17      Terry      Bill
18     Martin     Billy
19     Little     Grady
20    Johnson    Walter
>
> # Top 10 managers in terms of percentage of titles (league or divisional) -
> # should bias toward managers post-1970 since more first place finishes
> # are available
> head(arrange(subset(mgrTotals, yearBegin >= 1900 & games >= 500),
+                 -round(nfirst/nyear, 3)), 10)
    playerID nyear yearBegin yearEnd nTeams nfirst games    W    L WinPct
1  dierkla01     5      1997    2001      1      5   783  435  348  0.556
2  howsedi01     8      1978    1986      2      5   932  507  425  0.544
3   freyji99     5      1980    1986      2      3   610  323  287  0.530
4    coxbo01    29      1978    2010      2     15  4505 2504 2001  0.556
5  brenlbo01     4      2001    2004      1      2   565  303  262  0.536
6  kenneke99     4      1993    1996      2      2   582  309  273  0.531
7  manuech01    12      2000    2013      2      6  1826 1000  826  0.548
8  mattido01     4      2011    2014      1      2   647  354  293  0.547
9  morgajo01     4      1988    1991      1      2   563  301  262  0.535
10 gardero01    13      2002    2014      1      6  2107 1068 1039  0.507
     nameLast nameFirst
1     Dierker     Larry
2      Howser      Dick
3        Frey       Jim
4         Cox     Bobby
5      Brenly       Bob
6     Kennedy     Kevin
7      Manuel   Charlie
8   Mattingly       Don
9      Morgan       Joe
10 Gardenhire       Ron
>
> # How about pre-1969?
> head(arrange(subset(mgrTotals,
+                     yearBegin >= 1900 & yearEnd <= 1969 & games >= 500),
+                     -round(nfirst/nyear, 3)), 10)
    playerID nyear yearBegin yearEnd nTeams nfirst games    W    L WinPct
1  cochrmi01     5      1934    1938      1      2   598  348  250  0.582
2  stengca01    25      1934    1965      4     10  3747 1905 1842  0.508
3  mccarjo99    24      1926    1950      3      9  3458 2125 1333  0.615
4  chancfr01    11      1905    1923      3      4  1594  946  648  0.593
5  huggimi01    17      1913    1929      2      6  2547 1413 1134  0.555
6  colliji01     6      1901    1906      1      2   831  455  376  0.548
7  streega01     6      1929    1938      2      2   697  365  332  0.524
8  southbi01    13      1929    1951      2      4  1748 1044  704  0.597
9  terrybi01    10      1932    1941      1      3  1484  823  661  0.555
10 carribi02     7      1913    1929      1      2   989  489  500  0.494
     nameLast nameFirst
1    Cochrane    Mickey
2     Stengel     Casey
3    McCarthy       Joe
4      Chance     Frank
5     Huggins    Miller
6     Collins     Jimmy
7      Street     Gabby
8  Southworth     Billy
9       Terry      Bill
10   Carrigan      Bill
>
> ##############################################
> # Density plot of the number of games managed:
> ##############################################
>
> library('ggplot2')
> ggplot(mgrTotals, aes(x = games)) + geom_density(fill = 'red', alpha = 0.3) +
+     labs(x = 'Number of games managed')
>
> # Who managed more than 4000 games?
> subset(mgrTotals, games >= 4000)
     playerID nyear yearBegin yearEnd nTeams nfirst games    W    L WinPct
12  andersp01    26      1970    1995      2      7  4028 2194 1834  0.545
113   coxbo01    29      1978    2010      2     15  4505 2504 2001  0.556
243 harribu01    29      1924    1956      5      3  4377 2158 2219  0.493
335 larusto01    33      1979    2011      3     12  5093 2728 2365  0.536
364  mackco01    53      1894    1950      2      9  7679 3731 3948  0.486
400 mcgrajo01    33      1899    1932      3     11  4711 2763 1948  0.586
618 torrejo01    29      1977    2010      5     13  4323 2326 1997  0.538
    nameLast nameFirst
12  Anderson    Sparky
113      Cox     Bobby
243   Harris     Bucky
335  LaRussa      Tony
364     Mack    Connie
400   McGraw      John
618    Torre       Joe
> # Connie Mack had an advantage: he owned the Philadelphia A's :)
>
> # Table of Tony LaRussa's team finishes:
> with(subset(Managers, playerID == 'larusto01'), table(rank))
rank
 1  2  3  4  5  7
12  4  8  5  4  1
>
> # To include zero frequencies, one alternative is the tabulate() function:
> with(subset(Managers, playerID == 'larusto01'), tabulate(rank, 7))
[1] 12  4  8  5  4  0  1
>
>
> ##############################################
> # Scatterplot of winning percentage vs. number of games managed (min 100)
> ##############################################
>
> ggplot(subset(mgrTotals, yearBegin >= 1900 & games >= 100),
+        aes(x = games, y = WinPct)) + geom_point() + geom_smooth() +
+     labs(x = 'Number of games managed')
>
> ############################################
> # Division titles
> ############################################
>
> # Plot of number of first place finishes by managers with at least 8 years
> # of experience in the divisional era (>= 1969):
>
> divMgr <- subset(mgrTotals, yearBegin >= 1969 & nyear >= 8)
>
> # Response is the number of titles
> ggplot(divMgr, aes(x = nyear, y = nfirst)) +
+     geom_point(position = position_jitter(w = 0.2)) +
+     labs(x = 'Number of years', y = 'Number of divisional titles') +
+     geom_smooth()
Warning messages:
1: Removed 1 rows containing non-finite values (stat_smooth).
2: Removed 1 rows containing missing values (geom_point).
>
> # Response is the proportion of titles
> ggplot(divMgr, aes(x = nyear, y = round(nfirst/nyear, 3))) +
+     geom_point(position = position_jitter(w = 0.2)) +
+     labs(x = 'Number of years', y = 'Proportion of divisional titles') +
+     geom_smooth()
Warning messages:
1: Removed 1 rows containing non-finite values (stat_smooth).
2: Removed 1 rows containing missing values (geom_point).
>
>
>
>
>
>
> dev.off()
null device
          1
>
|
Created & Maintained by Osamu Ogasawara (osamu.ogasawara@gmail.com) and 