Supported by Dr. Osamu Ogasawara and  . . |
|
Last data update: 2014.03.03 |
Pitching tableDescriptionPitching table Usagedata(Pitching) FormatA data frame with 43330 observations on the following 30 variables.
SourceLahman, S. (2015) Lahman's Baseball Database, 1871-2014, 2015 version, http://baseball1.com/statistics/ Examples
# Pitching data
require(plyr)
###################################
# cleanup, and add some other stats
###################################
# Restrict to AL and NL data, 1901+
# All data re SH, SF and GIDP are missing, so remove
# Intentional walks (IBB) not recorded until 1955
pitching <- subset(Pitching, yearID >= 1901 & lgID %in% c("AL", "NL"))[, -(28:30)]
# Approximate missing BAOpp values (most common remaining missing value)
pitching$BAOpp <- with(pitching, round(H/(BFP - BB - HBP), 3))
# Compute WHIP (hits + walks per inning pitched -- lower is better)
pitching <- mutate(pitching,
WHIP = round((H + BB) * 3/IPouts, 2),
KperBB = round(ifelse(yearID >= 1955,
SO/(BB - IBB), SO/BB), 2))
#####################
# some simple queries
#####################
# Team pitching statistics, Toronto Blue Jays, 1993
tor93 <- subset(pitching, yearID == 1993 & teamID == "TOR")
arrange(tor93, ERA)
# Career pitching statistics, Greg Maddux
subset(pitching, playerID == "maddugr01")
# Best ERAs for starting pitchers post WWII
postwar <- subset(pitching, yearID >= 1946 & IPouts >= 600)
head(arrange(postwar, ERA), 10)
# Best K/BB ratios post-1955 among starters (excludes intentional walks)
post55 <- subset(pitching, yearID >= 1955 & IPouts >= 600)
post55 <- mutate(post55, KperBB = SO/(BB - IBB))
head(arrange(post55, desc(KperBB)), 10)
# Best K/BB ratios among relievers post-1950 (min. 20 saves)
head(arrange(subset(pitching, yearID >= 1950 & SV >= 20), desc(KperBB)), 10)
###############################################
# Winningest pitchers in each league each year:
###############################################
# Add name & throws information:
masterInfo <- Master[, c('playerID',
'nameLast', 'nameFirst', 'throws')]
pitching <- merge(pitching, masterInfo, all.x=TRUE)
wp <- ddply(pitching, .(yearID, lgID), subset, W == max(W),
select = c("playerID", "teamID", "W", "throws"))
anova(lm(formula = W ~ yearID + I(yearID^2) + lgID + throws, data = wp))
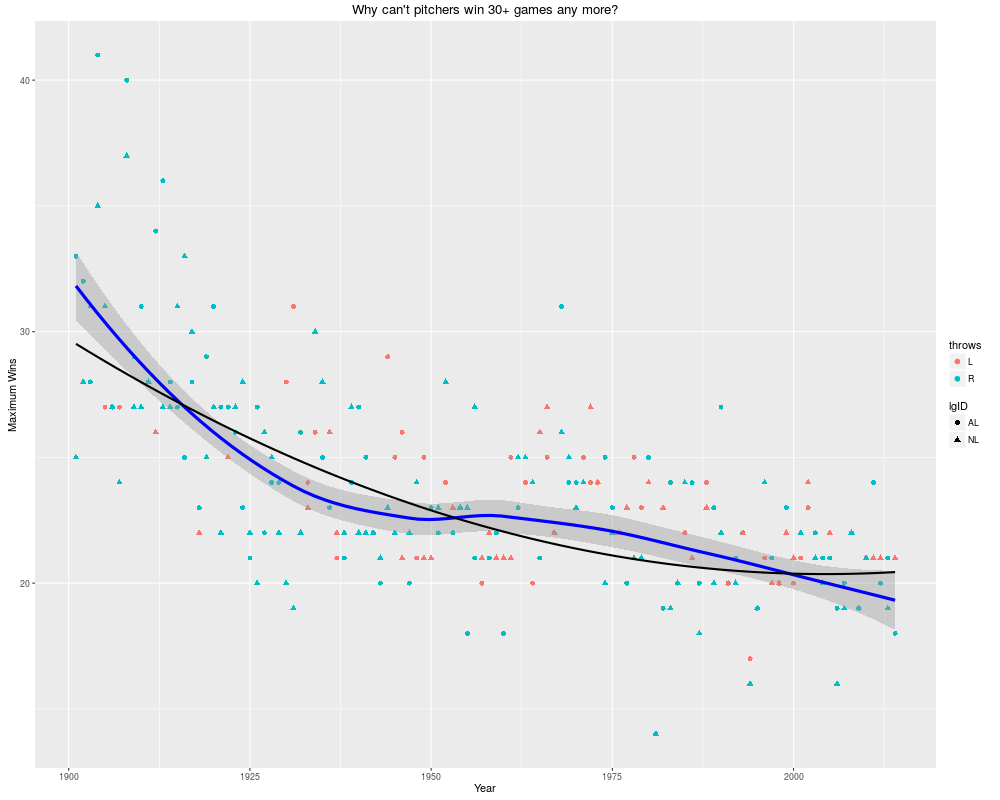
# an eye-catching, but naive, specious graph
require('ggplot2')
# compare loess smooth with quadratic fit
ggplot(wp, aes(x = yearID, y = W)) +
geom_point(aes(colour = throws, shape=lgID), size = 2) +
geom_smooth(method="loess", size=1.5, color="blue") +
geom_smooth(method = "lm", se=FALSE, color="black", formula = y ~ poly(x,2)) +
ylab("Maximum Wins") + xlab("Year") +
ggtitle("Why can't pitchers win 30+ games any more?")
Results
R version 3.3.1 (2016-06-21) -- "Bug in Your Hair"
Copyright (C) 2016 The R Foundation for Statistical Computing
Platform: x86_64-pc-linux-gnu (64-bit)

R is free software and comes with ABSOLUTELY NO WARRANTY.
You are welcome to redistribute it under certain conditions.
Type 'license()' or 'licence()' for distribution details.

R is a collaborative project with many contributors.
Type 'contributors()' for more information and
'citation()' on how to cite R or R packages in publications.

Type 'demo()' for some demos, 'help()' for on-line help, or
'help.start()' for an HTML browser interface to help.
Type 'q()' to quit R.

> library(Lahman)
> png(filename="/home/ddbj/snapshot/RGM3/R_CC/result/Lahman/Pitching.Rd_%03d_medium.png", width=480, height=480)
> ### Name: Pitching
> ### Title: Pitching table
> ### Aliases: Pitching
> ### Keywords: datasets
>
> ### ** Examples
>
> # Pitching data
>
> require(plyr)
Loading required package: plyr
>
> ###################################
> # cleanup, and add some other stats
> ###################################
>
> # Restrict to AL and NL data, 1901+
> # All data re SH, SF and GIDP are missing, so remove
> # Intentional walks (IBB) not recorded until 1955
> pitching <- subset(Pitching, yearID >= 1901 & lgID %in% c("AL", "NL"))[, -(28:30)]
>
> # Approximate missing BAOpp values (most common remaining missing value)
> pitching$BAOpp <- with(pitching, round(H/(BFP - BB - HBP), 3))
> # Compute WHIP (hits + walks per inning pitched -- lower is better)
> pitching <- mutate(pitching,
+                    WHIP = round((H + BB) * 3/IPouts, 2),
+                    KperBB = round(ifelse(yearID >= 1955,
+                                          SO/(BB - IBB), SO/BB), 2))
>
> #####################
> # some simple queries
> #####################
>
> # Team pitching statistics, Toronto Blue Jays, 1993
> tor93 <- subset(pitching, yearID == 1993 & teamID == "TOR")
> arrange(tor93, ERA)
    playerID yearID stint teamID lgID  W  L  G GS CG SHO SV IPouts   H  ER HR
1  dayleke01   1993     1    TOR   AL  0  0  2  0  0   0  0      2   1   0  0
2   warddu01   1993     1    TOR   AL  2  3 71  0  0   0 45    215  49  17  4
3  eichhma01   1993     1    TOR   AL  3  1 54  0  0   0  0    218  76  22  3
4    coxda01   1993     1    TOR   AL  7  6 44  0  0   0  2    251  73  29  8
5  castito02   1993     1    TOR   AL  3  2 51  0  0   0  0    152  44  19  4
6  hentgpa01   1993     1    TOR   AL 19  9 34 32  3   0  0    649 215  93 27
7  guzmaju01   1993     1    TOR   AL 14  3 33 33  2   1  0    663 211  98 17
8  flenehu01   1993     1    TOR   AL  0  0  6  0  0   0  0     20   7   3  0
9  leiteal01   1993     1    TOR   AL  9  6 34 12  1   1  2    315  93  48  8
10 williwo02   1993     1    TOR   AL  3  1 30  0  0   0  0    111  40  18  2
11 stewada01   1993     1    TOR   AL 12  8 26 26  0   0  0    486 146  80 23
12 timlimi01   1993     1    TOR   AL  4  2 54  0  0   0  1    167  63  29  7
13 stottto01   1993     1    TOR   AL 11 12 30 28  1   1  0    530 204  95 11
14  browsc01   1993     1    TOR   AL  1  1  6  3  0   0  0     54  19  12  2
15 morrija02   1993     1    TOR   AL  7 12 27 27  4   1  0    458 189 105 18
16 lintodo01   1993     1    TOR   AL  0  1  4  1  0   0  0     33  11   8  0
    BB  SO BAOpp  ERA IBB WP HBP BK BFP GF   R WHIP KperBB
1    4   2 0.333 0.00   0  0   0  0   7  0   2 7.50   0.50
2   25  97 0.191 2.13   2  7   1  0 282 70  17 1.03   4.22
3   22  47 0.268 2.72   7  2   3  0 309 16  26 1.35   3.13
4   29  84 0.229 3.12   5  5   0  0 348 13  31 1.22   3.50
5   22  28 0.233 3.38   5  1   0  0 211 10  19 1.30   1.65
6   74 122 0.254 3.87   0 11   7  1 926  0 103 1.34   1.65
7  110 194 0.248 3.99   2 26   3  1 963  0 107 1.45   1.80
8    4   2 0.269 4.05   1  1   0  0  30  1   3 1.65   0.67
9   56  66 0.236 4.11   2  2   4  2 454  4  52 1.42   1.22
10  22  24 0.268 4.38   3  2   1  1 172  9  18 1.68   1.26
11  72  96 0.239 4.44   0  4   4  1 687  0  86 1.35   1.33
12  27  49 0.279 4.69   3  1   1  0 254 27  32 1.62   2.04
13  69  98 0.286 4.84   5  7   3  1 786  0 107 1.55   1.53
14  10   7 0.264 6.00   1  0   1  0  83  1  15 1.61   0.78
15  65 103 0.298 6.19   2 14   3  1 702  0 116 1.66   1.63
16   9   4 0.244 6.55   0  0   1  0  55  0   8 1.82   0.44
>
> # Career pitching statistics, Greg Maddux
> subset(pitching, playerID == "maddugr01")
       playerID yearID stint teamID lgID  W  L  G GS CG SHO SV IPouts   H  ER
25671 maddugr01   1986     1    CHN   NL  2  4  6  5  1   0  0     93  44  19
26128 maddugr01   1987     1    CHN   NL  6 14 30 27  1   1  0    467 181  97
26586 maddugr01   1988     1    CHN   NL 18  8 34 34  9   3  0    747 230  88
27071 maddugr01   1989     1    CHN   NL 19 12 35 35  7   1  0    715 222  78
27575 maddugr01   1990     1    CHN   NL 15 15 35 35  8   2  0    711 242  91
28099 maddugr01   1991     1    CHN   NL 15 11 37 37  7   2  0    789 232  98
28571 maddugr01   1992     1    CHN   NL 20 11 35 35  9   4  0    804 201  65
29088 maddugr01   1993     1    ATL   NL 20 10 36 36  8   1  0    801 228  70
29604 maddugr01   1994     1    ATL   NL 16  6 25 25 10   3  0    606 150  35
30156 maddugr01   1995     1    ATL   NL 19  2 28 28 10   3  0    629 147  38
30750 maddugr01   1996     1    ATL   NL 15 11 35 35  5   1  0    735 225  74
31357 maddugr01   1997     1    ATL   NL 19  4 33 33  5   2  0    698 200  57
31940 maddugr01   1998     1    ATL   NL 18  9 34 34  9   5  0    753 201  62
32568 maddugr01   1999     1    ATL   NL 19  9 33 33  4   0  0    658 258  87
33219 maddugr01   2000     1    ATL   NL 19  9 35 35  6   3  0    748 225  83
33897 maddugr01   2001     1    ATL   NL 17 11 34 34  3   3  0    699 220  79
34558 maddugr01   2002     1    ATL   NL 16  6 34 34  0   0  0    598 194  58
35231 maddugr01   2003     1    ATL   NL 16 11 36 36  1   0  0    655 225  96
35937 maddugr01   2004     1    CHN   NL 16 11 33 33  2   1  0    638 218  95
36601 maddugr01   2005     1    CHN   NL 13 15 35 35  3   0  0    675 239 106
37264 maddugr01   2006     1    CHN   NL  9 11 22 22  0   0  0    409 153  71
37265 maddugr01   2006     2    LAN   NL  6  3 12 12  0   0  0    221  66  27
37968 maddugr01   2007     1    SDN   NL 14 11 34 34  1   0  0    594 221  91
38683 maddugr01   2008     1    SDN   NL  6  9 26 26  0   0  0    460 161  68
38684 maddugr01   2008     2    LAN   NL  2  4  7  7  0   0  0    122  43  23
      HR BB  SO BAOpp  ERA IBB WP HBP BK  BFP GF   R WHIP KperBB
25671  3 11  20 0.333 5.52   2  2   1  0  144  1  20 1.77   2.22
26128 17 74 101 0.291 5.61  13  4   4  7  701  2 111 1.64   1.66
26586 13 81 140 0.240 3.18  16  3   9  6 1047  0  97 1.25   2.15
27071 13 82 135 0.243 2.95  13  5   6  3 1002  0  90 1.28   1.96
27575 11 71 144 0.259 3.46  10  3   4  3 1011  0 116 1.32   2.36
28099 18 66 198 0.232 3.35   9  6   6  3 1070  0 113 1.13   3.47
28571  7 70 199 0.206 2.18   7  5  14  0 1061  0  68 1.01   3.16
29088 14 52 197 0.227 2.36   7  5   6  1 1064  0  85 1.05   4.38
29604  4 31 156 0.204 1.56   3  3   6  1  774  0  44 0.90   5.57
30156  8 23 181 0.194 1.63   3  1   4  0  785  0  39 0.81   9.05
30750 11 28 172 0.238 2.72  11  4   3  0  978  0  85 1.03  10.12
31357  9 20 177 0.231 2.20   6  0   6  0  893  0  58 0.95  12.64
31940 13 45 204 0.215 2.22  10  4   7  0  987  0  75 0.98   5.83
32568 16 37 136 0.287 3.57   8  1   4  0  940  0 103 1.34   4.69
33219 19 42 190 0.234 3.00  12  1  10  2 1012  0  91 1.07   6.33
33897 20 27 173 0.246 3.05  10  2   7  0  927  0  86 1.06  10.18
34558 14 45 118 0.252 2.62   7  1   4  0  820  0  67 1.20   3.11
35231 24 33 124 0.262 3.96   7  3   8  0  901  0 112 1.18   4.77
35937 35 33 151 0.263 4.02   4  2   9  0  872  0 103 1.18   5.21
36601 29 36 136 0.268 4.24   4  8   7  0  936  0 112 1.22   4.25
37264 14 23  81 0.279 4.69   3  0   0  0  572  0  78 1.29   4.05
37265  6 14  36 0.239 3.30   4  0   0  0  290  0  31 1.09   3.60
37968 14 25 104 0.277 4.14   3  5   6  0  830  0  92 1.24   4.73
38683 16 26  80 0.265 3.99   4  2   5  2  638  0  80 1.22   3.64
38684  5  4  18 0.267 5.09   1  0   1  0  166  0  25 1.16   6.00
>
> # Best ERAs for starting pitchers post WWII
> postwar <- subset(pitching, yearID >= 1946 & IPouts >= 600)
> head(arrange(postwar, ERA), 10)
    playerID yearID stint teamID lgID  W L  G GS CG SHO SV IPouts   H ER HR BB
1  gibsobo01   1968     1    SLN   NL 22 9 34 34 28  13  0    914 198 38 11 62
2  goodedw01   1985     1    NYN   NL 24 4 35 35 16   8  0    830 198 47 13 69
3  maddugr01   1994     1    ATL   NL 16 6 25 25 10   3  0    606 150 35  4 31
4  tiantlu01   1968     1    CLE   AL 21 9 34 32 19   9  0    775 152 46 16 73
5  maddugr01   1995     1    ATL   NL 19 2 28 28 10   3  0    629 147 38  8 23
6  chancde01   1964     1    LAA   AL 20 9 46 35 15  11  4    835 194 51  7 86
7  koufasa01   1966     1    LAN   NL 27 9 41 41 27   5  0    969 241 62 19 77
8  koufasa01   1964     1    LAN   NL 19 5 29 28 15   7  1    669 154 43 13 53
9  guidrro01   1978     1    NYA   AL 25 3 35 35 16   9  0    821 187 53 13 72
10 martipe02   2000     1    BOS   AL 18 6 29 29  7   4  0    651 128 42 17 32
    SO BAOpp  ERA IBB WP HBP BK  BFP GF  R WHIP KperBB
1  268 0.181 1.12   6  4   7  0 1161  0 49 0.85   4.79
2  268 0.199 1.53   4  6   2  2 1065  0 51 0.97   4.12
3  156 0.204 1.56   3  3   6  1  774  0 44 0.90   5.57
4  264 0.167 1.60   4  3   4  0  987  0 53 0.87   3.83
5  181 0.194 1.63   3  1   4  0  785  0 39 0.81   9.05
6  207 0.193 1.65   9  9   2  0 1093  7 56 1.01   2.69
7  317 0.201 1.73   4  7   0  0 1274  0 74 0.98   4.34
8  223 0.188 1.74   5  9   0  0  870  1 49 0.93   4.65
9  248 0.190 1.74   1  7   1  1 1057  0 61 0.95   3.49
10 284 0.166 1.74   0  1  14  0  817  0 44 0.74   8.88
>
> # Best K/BB ratios post-1955 among starters (excludes intentional walks)
> post55 <- subset(pitching, yearID >= 1955 & IPouts >= 600)
> post55 <- mutate(post55, KperBB = SO/(BB - IBB))
> head(arrange(post55, desc(KperBB)), 10)
    playerID yearID stint teamID lgID  W  L  G GS CG SHO SV IPouts   H  ER HR
1  maddugr01   1997     1    ATL   NL 19  4 33 33  5   2  0    698 200  57  9
2  hugheph01   2014     1    MIN   AL 16 10 32 32  1   0  0    629 221  82 16
3  maddugr01   2001     1    ATL   NL 17 11 34 34  3   3  0    699 220  79 20
4  maddugr01   1996     1    ATL   NL 15 11 35 35  5   1  0    735 225  74 11
5  schilcu01   2002     1    ARI   NL 23  7 36 35  5   1  0    778 218  93 29
6  maddugr01   1995     1    ATL   NL 19  2 28 28 10   3  0    629 147  38  8
7  martipe02   2000     1    BOS   AL 18  6 29 29  7   4  0    651 128  42 17
8  martipe02   1999     1    BOS   AL 23  4 31 29  5   1  0    640 160  49  9
9  sheetbe01   2004     1    MIL   NL 12 14 34 34  5   0  0    711 201  71 25
10 jenkife01   1971     1    CHN   NL 24 13 39 39 30   3  0    975 304 100 29
   BB  SO BAOpp  ERA IBB WP HBP BK  BFP GF   R WHIP    KperBB
1  20 177 0.231 2.20   6  0   6  0  893  0  58 0.95 12.642857
2  16 186 0.265 3.52   1  1   5  0  855  0  88 1.13 12.400000
3  27 173 0.246 3.05  10  2   7  0  927  0  86 1.06 10.176471
4  28 172 0.238 2.72  11  4   3  0  978  0  85 1.03 10.117647
5  33 316 0.222 3.23   1  6   3  0 1017  0  95 0.97  9.875000
6  23 181 0.194 1.63   3  1   4  0  785  0  39 0.81  9.050000
7  32 284 0.166 1.74   0  1  14  0  817  0  44 0.74  8.875000
8  37 313 0.203 2.07   1  6   9  0  835  1  56 0.92  8.694444
9  32 264 0.223 2.70   1  8   4  1  937  0  85 0.98  8.516129
10 37 263 0.242 2.77   6  3   5  4 1299  0 114 1.05  8.483871
>
> # Best K/BB ratios among relievers post-1950 (min. 20 saves)
> head(arrange(subset(pitching, yearID >= 1950 & SV >= 20), desc(KperBB)), 10)
    playerID yearID stint teamID lgID W L  G GS CG SHO SV IPouts  H ER HR BB
1  eckerde01   1990     1    OAK   AL 4 2 63  0  0   0 48    220 41  5  2  4
2  eckerde01   1992     1    OAK   AL 7 1 69  0  0   0 51    240 62 17  5 11
3  eckerde01   1989     1    OAK   AL 4 0 51  0  0   0 33    173 32 10  5  3
4  eckerde01   1991     1    OAK   AL 5 4 67  0  0   0 43    228 60 25 11  9
5  ueharko01   2013     1    BOS   AL 4 1 73  0  0   0 21    223 33  9  5  9
6  riverma01   2008     1    NYA   AL 6 5 64  0  0   0 39    212 41 11  4  6
7  doolise01   2014     1    OAK   AL 2 4 61  0  0   0 22    188 38 19  5  8
8  eckerde01   1996     1    SLN   NL 0 6 63  0  0   0 30    180 65 22  8  6
9  hoffmtr01   2000     1    SDN   NL 4 7 70  0  0   0 43    217 61 24  7 11
10 wagnebi02   2004     1    PHI   NL 4 0 45  0  0   0 21    145 31 13  5  6
    SO BAOpp  ERA IBB WP HBP BK BFP GF  R WHIP KperBB
1   73 0.159 0.61   1  0   0  0 262 61  9 0.61  24.33
2   93 0.209 1.91   6  0   1  0 309 65 17 0.91  18.60
3   55 0.158 1.56   0  0   1  0 206 46 10 0.61  18.33
4   87 0.208 2.96   3  1   1  0 299 59 26 0.91  14.50
5  101 0.129 1.09   2  1   1  0 265 40 10 0.57  14.43
6   77 0.163 1.40   0  1   2  0 259 60 11 0.67  12.83
7   89 0.167 2.73   1  0   0  0 236 40 19 0.73  12.71
8   49 0.270 3.30   2  0   4  0 251 53 26 1.18  12.25
9   85 0.218 2.99   4  4   0  0 291 59 29 1.00  12.14
10  59 0.178 2.42   1  1   2  0 182 38 16 0.77  11.80
>
> ###############################################
> # Winningest pitchers in each league each year:
> ###############################################
>
> # Add name & throws information:
> masterInfo <- Master[, c('playerID',
+                          'nameLast', 'nameFirst', 'throws')]
> pitching <- merge(pitching, masterInfo, all.x=TRUE)
>
> wp <- ddply(pitching, .(yearID, lgID), subset, W == max(W),
+          select = c("playerID", "teamID", "W", "throws"))
>
> anova(lm(formula = W ~ yearID + I(yearID^2) + lgID + throws, data = wp))
Analysis of Variance Table

Response: W
             Df  Sum Sq Mean Sq  F value    Pr(>F)
yearID        1 1911.58 1911.58 210.0022 < 2.2e-16 ***
I(yearID^2)   1  204.63  204.63  22.4807 3.304e-06 ***
lgID          1   28.68   28.68   3.1511   0.07690 .
throws        1   32.76   32.76   3.5984   0.05881 .
Residuals   296 2694.39    9.10
---
Signif. codes:  0 '***' 0.001 '**' 0.01 '*' 0.05 '.' 0.1 ' ' 1
>
> # an eye-catching, but naive, specious graph
>
> require('ggplot2')
Loading required package: ggplot2
> # compare loess smooth with quadratic fit
> ggplot(wp, aes(x = yearID, y = W)) +
+     geom_point(aes(colour = throws, shape=lgID), size = 2) +
+     geom_smooth(method="loess", size=1.5, color="blue") +
+     geom_smooth(method = "lm", se=FALSE, color="black", formula = y ~ poly(x,2)) +
+     ylab("Maximum Wins") + xlab("Year") +
+     ggtitle("Why can't pitchers win 30+ games any more?")
>
>
>
>
>
>
>
> dev.off()
null device
          1
>
|
Created & Maintained by Osamu Ogasawara (osamu.ogasawara@gmail.com) and 