Supported by Dr. Osamu Ogasawara and  . . |
|
Last data update: 2014.03.03 |
Example De data sets for the package LuminescenceDescriptionEquivalent dose (De) values measured for a fine grain quartz sample from a loess section in Rottewitz (Saxony/Germany) and for a coarse grain quartz sample from a fluvial deposit in the rock shelter of Cueva Anton (Murcia/Spain). FormatA
ReferencesBT998 BT998
CA1
Examples
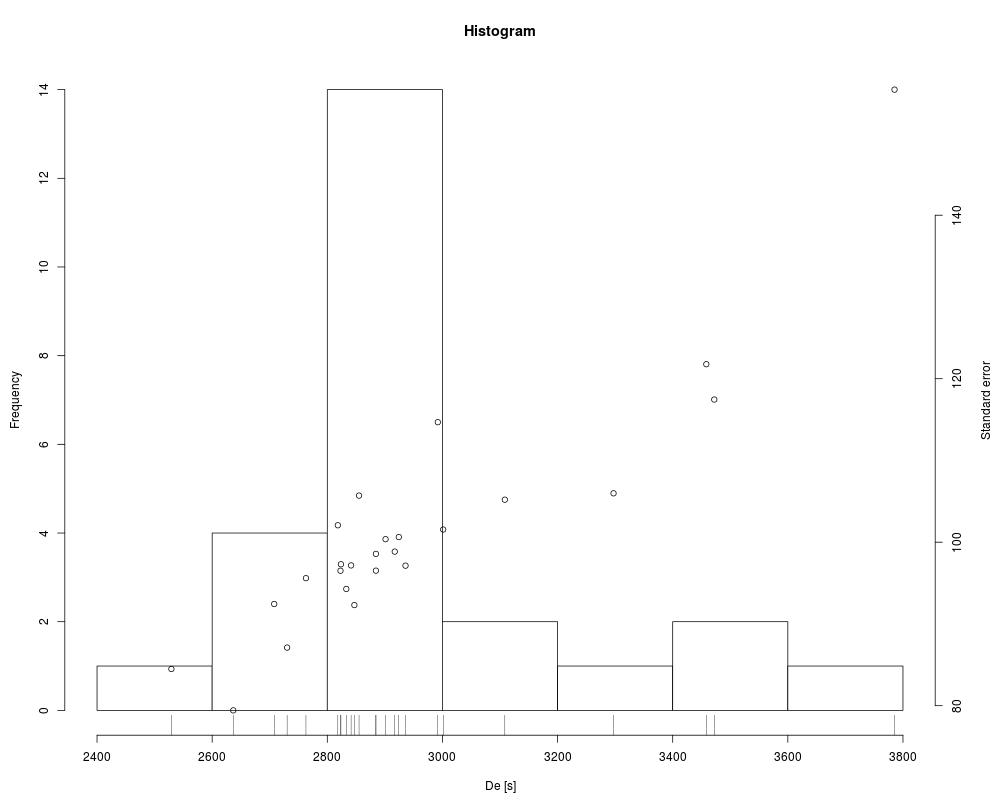
##(1) plot values as histogram
data(ExampleData.DeValues, envir = environment())
plot_Histogram(ExampleData.DeValues$BT998, xlab = "De [s]")
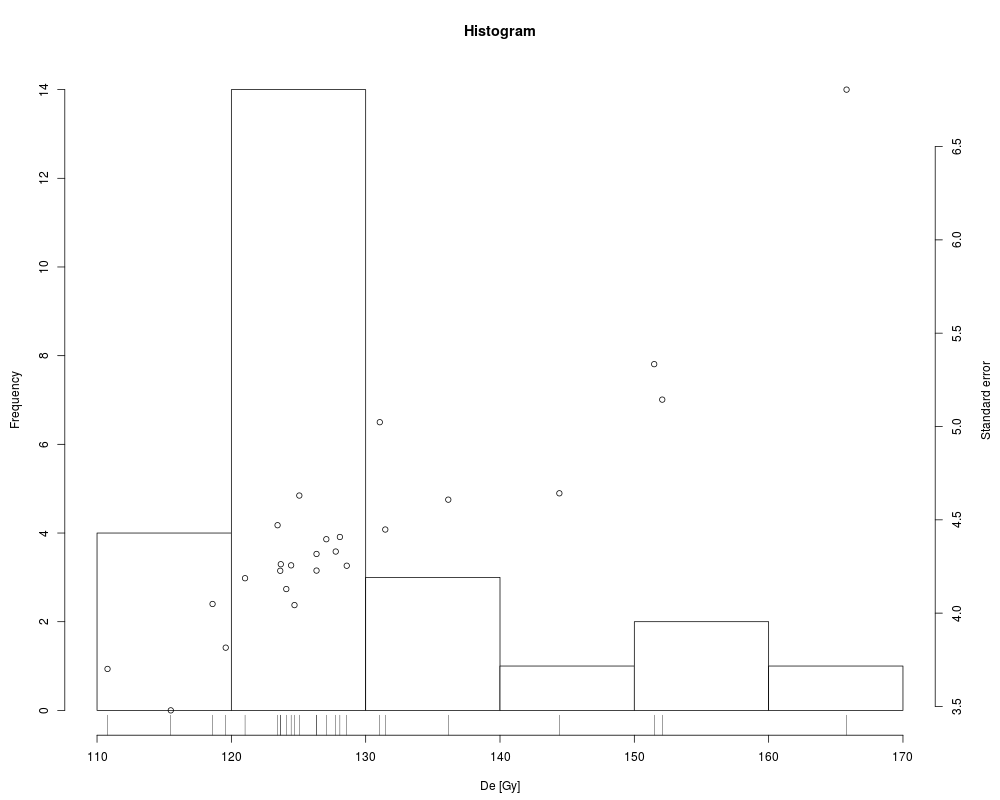
##(2) plot values as histogram (with second to gray conversion)
data(ExampleData.DeValues, envir = environment())
De.values <- Second2Gray(ExampleData.DeValues$BT998,
dose.rate = c(0.0438, 0.0019))
plot_Histogram(De.values, xlab = "De [Gy]")
Results
R version 3.3.1 (2016-06-21) -- "Bug in Your Hair"
Copyright (C) 2016 The R Foundation for Statistical Computing
Platform: x86_64-pc-linux-gnu (64-bit)

R is free software and comes with ABSOLUTELY NO WARRANTY.
You are welcome to redistribute it under certain conditions.
Type 'license()' or 'licence()' for distribution details.

R is a collaborative project with many contributors.
Type 'contributors()' for more information and
'citation()' on how to cite R or R packages in publications.

Type 'demo()' for some demos, 'help()' for on-line help, or
'help.start()' for an HTML browser interface to help.
Type 'q()' to quit R.

> library(Luminescence)
Welcome to the R package Luminescence version 0.6.0 [Built: 2016-05-30 16:47:30 UTC]
A trapped charge: 'I want to break free.'
> png(filename="/home/ddbj/snapshot/RGM3/R_CC/result/Luminescence/ExampleData.DeValues.Rd_%03d_medium.png", width=480, height=480)
> ### Name: ExampleData.DeValues
> ### Title: Example De data sets for the package Luminescence
> ### Aliases: ExampleData.DeValues
> ### Keywords: datasets
>
> ### ** Examples
>
>
> ##(1) plot values as histogram
> data(ExampleData.DeValues, envir = environment())
> plot_Histogram(ExampleData.DeValues$BT998, xlab = "De [s]")
>
> ##(2) plot values as histogram (with second to gray conversion)
> data(ExampleData.DeValues, envir = environment())
>
> De.values <- Second2Gray(ExampleData.DeValues$BT998,
+                          dose.rate = c(0.0438, 0.0019))
>
>
> plot_Histogram(De.values, xlab = "De [Gy]")
>
>
>
>
>
>
> dev.off()
null device
          1
>
|