Supported by Dr. Osamu Ogasawara and  . . |
|
Last data update: 2014.03.03 |
Example data for a SAR OSL measurement and a TL spectrum using a lexsyg readerDescriptionExample data from a SAR OSL measurement and a TL spectrum for package
Luminescence imported from a Freiberg Instruments XSYG file using the
function Format
The data contain two elements: (a)
Version0.1 SourceOSL.SARMeasurement
TL.Spectrum
ReferencesUnpublished data measured to serve as example data for that package. Location origin of sample BT753 is given here: Fuchs, M., Kreutzer, S., Rousseau, D.D., Antoine, P., Hatte, C., Lagroix, F., Moine, O., Gauthier, C., Svoboda, J., Lisa, L., 2013. The loess sequence of Dolni Vestonice, Czech Republic: A new OSL-based chronology of the Last Climatic Cycle. Boreas, 42, 664–677. See Also
Examples
##show data
data(ExampleData.XSYG, envir = environment())
## =========================================
##(1) OSL.SARMeasurement
OSL.SARMeasurement
##show $Sequence.Object
OSL.SARMeasurement$Sequence.Object
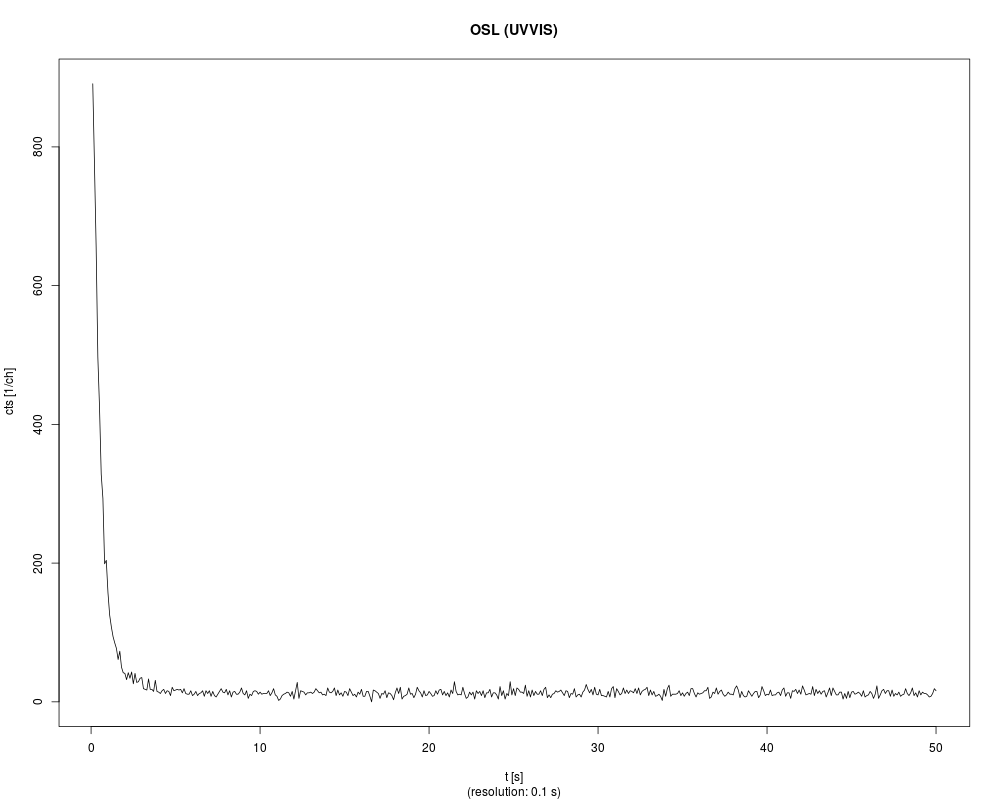
##grep OSL curves and plot the first curve
OSLcurve <- get_RLum(OSL.SARMeasurement$Sequence.Object,
recordType="OSL")[[1]]
plot_RLum(OSLcurve)
## =========================================
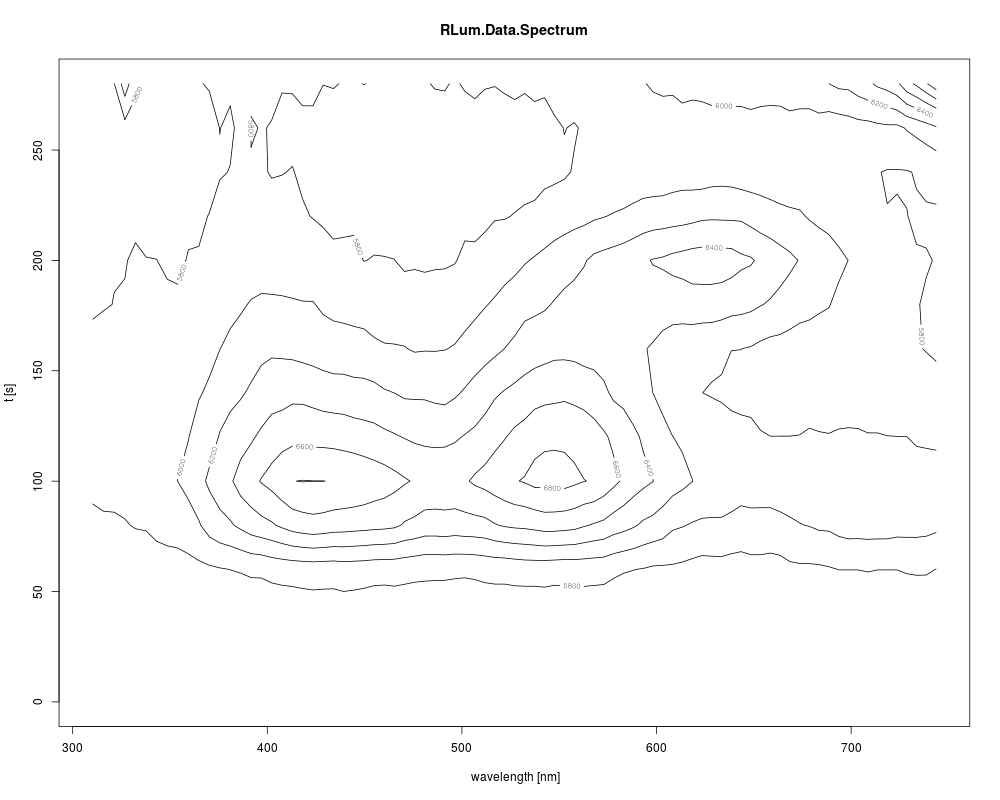
##(2) TL.Spectrum
TL.Spectrum
##plot simple spectrum (2D)
plot_RLum.Data.Spectrum(TL.Spectrum,
plot.type="contour",
xlim = c(310,750),
ylim = c(0,300),
bin.rows=10,
bin.cols = 1)
##plot 3d spectrum (uncomment for usage)
# plot_RLum.Data.Spectrum(TL.Spectrum, plot.type="persp",
# xlim = c(310,750), ylim = c(0,300), bin.rows=10,
# bin.cols = 1)
Results
R version 3.3.1 (2016-06-21) -- "Bug in Your Hair"
Copyright (C) 2016 The R Foundation for Statistical Computing
Platform: x86_64-pc-linux-gnu (64-bit)

R is free software and comes with ABSOLUTELY NO WARRANTY.
You are welcome to redistribute it under certain conditions.
Type 'license()' or 'licence()' for distribution details.

R is a collaborative project with many contributors.
Type 'contributors()' for more information and
'citation()' on how to cite R or R packages in publications.

Type 'demo()' for some demos, 'help()' for on-line help, or
'help.start()' for an HTML browser interface to help.
Type 'q()' to quit R.

> library(Luminescence)
Welcome to the R package Luminescence version 0.6.0 [Built: 2016-05-30 16:47:30 UTC]
The ordinary reviewer: 'I love it when a plan comes together.'
> png(filename="/home/ddbj/snapshot/RGM3/R_CC/result/Luminescence/ExampleData.XSYG.Rd_%03d_medium.png", width=480, height=480)
> ### Name: ExampleData.XSYG
> ### Title: Example data for a SAR OSL measurement and a TL spectrum using a
> ###   lexsyg reader
> ### Aliases: ExampleData.XSYG
> ### Keywords: datasets
>
> ### ** Examples
>
>
> ##show data
> data(ExampleData.XSYG, envir = environment())
>
> ## =========================================
> ##(1) OSL.SARMeasurement
> OSL.SARMeasurement
$Sequence.Header

state                           finished
parentID                1002220348205854
name      R Luminescence example dataset
position                              30
comment                  example dataset
startDate                 20140222034820
protocol                             SAR
mineral                           quartz

$Sequence.Object

 [RLum.Analysis]
	 originator: read_XSYG2R()
	 protocol: SAR
	 additional info elements:  0
	 number of records: 124
	 .. : RLum.Data.Curve : 124
	 .. .. :  TL (UVVIS)  TL (NA)  TL (NA)  OSL (UVVIS)  OSL (NA)  OSL (NA)  OSL (NA)  OSL (NA)  irradiation (NA)  TL (UVVIS)
	 .. .. :  TL (NA)  TL (NA)  OSL (UVVIS)  OSL (NA)  OSL (NA)  OSL (NA)  OSL (NA)  irradiation (NA)  TL (UVVIS)  TL (NA)
	 .. .. :  TL (NA)  OSL (UVVIS)  OSL (NA)  OSL (NA)  OSL (NA)  OSL (NA)  irradiation (NA)  TL (UVVIS)  TL (NA)  TL (NA)
	 .. .. :  OSL (UVVIS)  OSL (NA)  OSL (NA)  OSL (NA)  OSL (NA)  irradiation (NA)  TL (UVVIS)  TL (NA)  TL (NA)  OSL (UVVIS)
	 .. .. :  OSL (NA)  OSL (NA)  OSL (NA)  OSL (NA)  irradiation (NA)  TL (UVVIS)  TL (NA)  TL (NA)  OSL (UVVIS)  OSL (NA)
	 .. .. :  OSL (NA)  OSL (NA)  OSL (NA)  irradiation (NA)  TL (UVVIS)  TL (NA)  TL (NA)  OSL (UVVIS)  OSL (NA)  OSL (NA)
	 .. .. :  OSL (NA)  OSL (NA)  irradiation (NA)  TL (UVVIS)  TL (NA)  TL (NA)  OSL (UVVIS)  OSL (NA)  OSL (NA)  OSL (NA)
	 .. .. :  OSL (NA)  irradiation (NA)  TL (UVVIS)  TL (NA)  TL (NA)  OSL (UVVIS)  OSL (NA)  OSL (NA)  OSL (NA)  OSL (NA)
	 .. .. :  irradiation (NA)  TL (UVVIS)  TL (NA)  TL (NA)  OSL (UVVIS)  OSL (NA)  OSL (NA)  OSL (NA)  OSL (NA)  TL (UVVIS)
	 .. .. :  TL (NA)  TL (NA)  OSL (UVVIS)  OSL (NA)  OSL (NA)  OSL (NA)  OSL (NA)  irradiation (NA)  TL (UVVIS)  TL (NA)
	 .. .. :  TL (NA)  OSL (UVVIS)  OSL (NA)  OSL (NA)  OSL (NA)  OSL (NA)  irradiation (NA)  TL (UVVIS)  TL (NA)  TL (NA)
	 .. .. :  OSL (UVVIS)  OSL (NA)  OSL (NA)  OSL (NA)  OSL (NA)  irradiation (NA)  TL (UVVIS)  TL (NA)  TL (NA)  OSL (UVVIS)
	 .. .. :  OSL (NA)  OSL (NA)  OSL (NA)  OSL (NA)
>
> ##show $Sequence.Object
> OSL.SARMeasurement$Sequence.Object

 [RLum.Analysis]
	 originator: read_XSYG2R()
	 protocol: SAR
	 additional info elements:  0
	 number of records: 124
	 .. : RLum.Data.Curve : 124
	 .. .. :  TL (UVVIS)  TL (NA)  TL (NA)  OSL (UVVIS)  OSL (NA)  OSL (NA)  OSL (NA)  OSL (NA)  irradiation (NA)  TL (UVVIS)
	 .. .. :  TL (NA)  TL (NA)  OSL (UVVIS)  OSL (NA)  OSL (NA)  OSL (NA)  OSL (NA)  irradiation (NA)  TL (UVVIS)  TL (NA)
	 .. .. :  TL (NA)  OSL (UVVIS)  OSL (NA)  OSL (NA)  OSL (NA)  OSL (NA)  irradiation (NA)  TL (UVVIS)  TL (NA)  TL (NA)
	 .. .. :  OSL (UVVIS)  OSL (NA)  OSL (NA)  OSL (NA)  OSL (NA)  irradiation (NA)  TL (UVVIS)  TL (NA)  TL (NA)  OSL (UVVIS)
	 .. .. :  OSL (NA)  OSL (NA)  OSL (NA)  OSL (NA)  irradiation (NA)  TL (UVVIS)  TL (NA)  TL (NA)  OSL (UVVIS)  OSL (NA)
	 .. .. :  OSL (NA)  OSL (NA)  OSL (NA)  irradiation (NA)  TL (UVVIS)  TL (NA)  TL (NA)  OSL (UVVIS)  OSL (NA)  OSL (NA)
	 .. .. :  OSL (NA)  OSL (NA)  irradiation (NA)  TL (UVVIS)  TL (NA)  TL (NA)  OSL (UVVIS)  OSL (NA)  OSL (NA)  OSL (NA)
	 .. .. :  OSL (NA)  irradiation (NA)  TL (UVVIS)  TL (NA)  TL (NA)  OSL (UVVIS)  OSL (NA)  OSL (NA)  OSL (NA)  OSL (NA)
	 .. .. :  irradiation (NA)  TL (UVVIS)  TL (NA)  TL (NA)  OSL (UVVIS)  OSL (NA)  OSL (NA)  OSL (NA)  OSL (NA)  TL (UVVIS)
	 .. .. :  TL (NA)  TL (NA)  OSL (UVVIS)  OSL (NA)  OSL (NA)  OSL (NA)  OSL (NA)  irradiation (NA)  TL (UVVIS)  TL (NA)
	 .. .. :  TL (NA)  OSL (UVVIS)  OSL (NA)  OSL (NA)  OSL (NA)  OSL (NA)  irradiation (NA)  TL (UVVIS)  TL (NA)  TL (NA)
	 .. .. :  OSL (UVVIS)  OSL (NA)  OSL (NA)  OSL (NA)  OSL (NA)  irradiation (NA)  TL (UVVIS)  TL (NA)  TL (NA)  OSL (UVVIS)
	 .. .. :  OSL (NA)  OSL (NA)  OSL (NA)  OSL (NA) >
> ##grep OSL curves and plot the first curve
> OSLcurve <- get_RLum(OSL.SARMeasurement$Sequence.Object,
+ recordType="OSL")[[1]]
> plot_RLum(OSLcurve)
>
> ## =========================================
> ##(2) TL.Spectrum
> TL.Spectrum

 [RLum.Data.Spectrum]
	 recordType: TL (Spectrometer)
	 curveType: measured
	 .. recorded frames: 24
	 .. .. measured values per frame: 1024
	 .. .. range wavelength/pixel: 296.5 823.126
	 .. .. range time/temp.: 0.029 460.007
	 .. .. range count values: 554 65405
	 additional info elements: 14>
> ##plot simple spectrum (2D)
> plot_RLum.Data.Spectrum(TL.Spectrum,
+                         plot.type="contour",
+                         xlim = c(310,750),
+                         ylim = c(0,300),
+                         bin.rows=10,
+                         bin.cols = 1)
Warning message:
In plot_RLum.Data.Spectrum(TL.Spectrum, plot.type = "contour", xlim = c(310,  :
  Last wavelength channel has been removed due to binning.
>
> ##plot 3d spectrum (uncomment for usage)
> # plot_RLum.Data.Spectrum(TL.Spectrum, plot.type="persp",
> # xlim = c(310,750), ylim = c(0,300), bin.rows=10,
> # bin.cols = 1)
>
>
>
>
>
>
> dev.off()
null device
          1
>
|