Supported by Dr. Osamu Ogasawara and  . . |
|
Last data update: 2014.03.03 |
Survival Times and White Blood Counts for Leukaemia PatientsDescriptionA data frame of data from 33 leukaemia patients. Usageleuk FormatA data frame with columns:
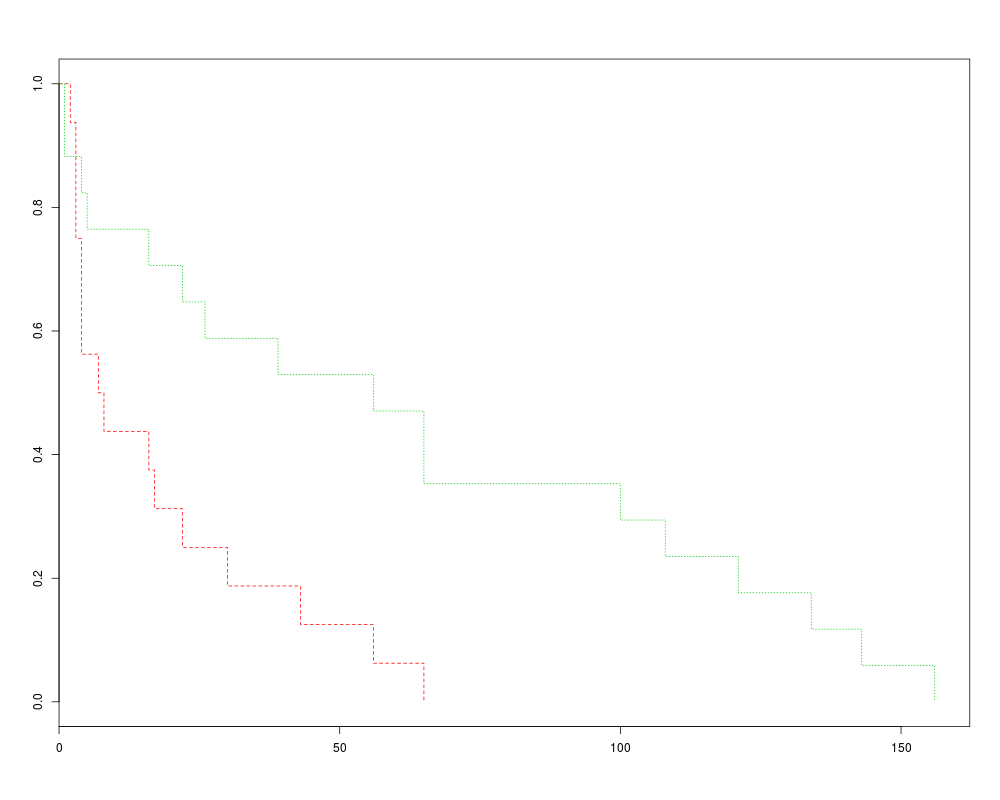
DetailsSurvival times are given for 33 patients who died from acute myelogenous leukaemia. Also measured was the patient's white blood cell count at the time of diagnosis. The patients were also factored into 2 groups according to the presence or absence of a morphologic characteristic of white blood cells. Patients termed AG positive were identified by the presence of Auer rods and/or significant granulation of the leukaemic cells in the bone marrow at the time of diagnosis. SourceCox, D. R. and Oakes, D. (1984) Analysis of Survival Data. Chapman & Hall, p. 9. Taken from Feigl, P. & Zelen, M. (1965) Estimation of exponential survival probabilities with concomitant information. Biometrics 21, 826–838. ReferencesVenables, W. N. and Ripley, B. D. (2002) Modern Applied Statistics with S. Fourth edition. Springer. Exampleslibrary(survival) plot(survfit(Surv(time) ~ ag, data = leuk), lty = 2:3, col = 2:3) # now Cox models leuk.cox <- coxph(Surv(time) ~ ag + log(wbc), leuk) summary(leuk.cox) Results
R version 3.3.1 (2016-06-21) -- "Bug in Your Hair"
Copyright (C) 2016 The R Foundation for Statistical Computing
Platform: x86_64-pc-linux-gnu (64-bit)

R is free software and comes with ABSOLUTELY NO WARRANTY.
You are welcome to redistribute it under certain conditions.
Type 'license()' or 'licence()' for distribution details.

R is a collaborative project with many contributors.
Type 'contributors()' for more information and
'citation()' on how to cite R or R packages in publications.

Type 'demo()' for some demos, 'help()' for on-line help, or
'help.start()' for an HTML browser interface to help.
Type 'q()' to quit R.

> library(MASS)
> png(filename="/home/ddbj/snapshot/RGM3/R_CC/result/MASS/leuk.Rd_%03d_medium.png", width=480, height=480)
> ### Name: leuk
> ### Title: Survival Times and White Blood Counts for Leukaemia Patients
> ### Aliases: leuk
> ### Keywords: datasets
>
> ### ** Examples
>
> library(survival)
> plot(survfit(Surv(time) ~ ag, data = leuk), lty = 2:3, col = 2:3)
>
> # now Cox models
> leuk.cox <- coxph(Surv(time) ~ ag + log(wbc), leuk)
> summary(leuk.cox)
Call:
coxph(formula = Surv(time) ~ ag + log(wbc), data = leuk)

  n= 33, number of events= 33

             coef exp(coef) se(coef)      z Pr(>|z|)
agpresent -1.0691    0.3433   0.4293 -2.490  0.01276 *
log(wbc)   0.3677    1.4444   0.1360  2.703  0.00687 **
---
Signif. codes:  0 '***' 0.001 '**' 0.01 '*' 0.05 '.' 0.1 ' ' 1

          exp(coef) exp(-coef) lower .95 upper .95
agpresent    0.3433     2.9126     0.148    0.7964
log(wbc)     1.4444     0.6923     1.106    1.8857

Concordance= 0.726  (se = 0.065 )
Rsquare= 0.377   (max possible= 0.994 )
Likelihood ratio test= 15.64  on 2 df,   p=0.0004014
Wald test            = 15.06  on 2 df,   p=0.0005365
Score (logrank) test = 16.49  on 2 df,   p=0.0002629

>
>
>
>
>
> dev.off()
null device
          1
>
|